

STATISTICS
LMTHw
LMTHw

You also want an ePaper? Increase the reach of your titles
YUMPU automatically turns print PDFs into web optimized ePapers that Google loves.
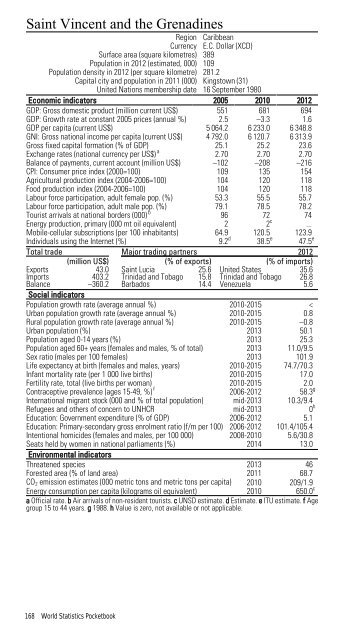
Saint Vincent and the Grenadines<br />
Region Caribbean<br />
Currency E.C. Dollar (XCD)<br />
Surface area (square kilometres) 389<br />
Population in 2012 (estimated, 000) 109<br />
Population density in 2012 (per square kilometre) 281.2<br />
Capital city and population in 2011 (000) Kingstown (31)<br />
United Nations membership date 16 September 1980<br />
Economic indicators 2005 2010 2012<br />
GDP: Gross domestic product (million current US$) 551 681 694<br />
GDP: Growth rate at constant 2005 prices (annual %) 2.5 –3.3 1.6<br />
GDP per capita (current US$) 5 064.2 6 233.0 6 348.8<br />
GNI: Gross national income per capita (current US$) 4 792.0 6 120.7 6 313.9<br />
Gross fixed capital formation (% of GDP) 25.1 25.2 23.6<br />
Exchange rates (national currency per US$) a 2.70 2.70 2.70<br />
Balance of payments, current account (million US$) –102 –208 –216<br />
CPI: Consumer price index (2000=100) 109 135 154<br />
Agricultural production index (2004-2006=100) 104 120 118<br />
Food production index (2004-2006=100) 104 120 118<br />
Labour force participation, adult female pop. (%) 53.3 55.5 55.7<br />
Labour force participation, adult male pop. (%) 79.1 78.5 78.2<br />
Tourist arrivals at national borders (000) b 96 72 74<br />
Energy production, primary (000 mt oil equivalent) 2 2 c ...<br />
Mobile-cellular subscriptions (per 100 inhabitants) 64.9 120.5 123.9<br />
Individuals using the Internet (%) 9.2 d 38.5 e 47.5 e<br />
Total trade Major trading partners 2012<br />
(million US$) (% of exports) (% of imports)<br />
Exports 43.0 Saint Lucia 25.6 United States 35.6<br />
Imports 403.2 Trinidad and Tobago 15.8 Trinidad and Tobago 26.8<br />
Balance –360.2 Barbados 14.4 Venezuela 5.6<br />
Social indicators<br />
Population growth rate (average annual %) 2010-2015 <<br />
Urban population growth rate (average annual %) 2010-2015 0.8<br />
Rural population growth rate (average annual %) 2010-2015 –0.8<br />
Urban population (%) 2013 50.1<br />
Population aged 0-14 years (%) 2013 25.3<br />
Population aged 60+ years (females and males, % of total) 2013 11.0/9.5<br />
Sex ratio (males per 100 females) 2013 101.9<br />
Life expectancy at birth (females and males, years) 2010-2015 74.7/70.3<br />
Infant mortality rate (per 1 000 live births) 2010-2015 17.0<br />
Fertility rate, total (live births per woman) 2010-2015 2.0<br />
Contraceptive prevalence (ages 15-49, %) f 2006-2012 58.3 g<br />
International migrant stock (000 and % of total population) mid-2013 10.3/9.4<br />
Refugees and others of concern to UNHCR mid-2013 0 h<br />
Education: Government expenditure (% of GDP) 2006-2012 5.1<br />
Education: Primary-secondary gross enrolment ratio (f/m per 100) 2006-2012 101.4/105.4<br />
Intentional homicides (females and males, per 100 000) 2008-2010 5.6/30.8<br />
Seats held by women in national parliaments (%) 2014 13.0<br />
Environmental indicators<br />
Threatened species 2013 46<br />
Forested area (% of land area) 2011 68.7<br />
CO 2 emission estimates (000 metric tons and metric tons per capita) 2010 209/1.9<br />
Energy consumption per capita (kilograms oil equivalent) 2010 650.0 c<br />
a Official rate. b Air arrivals of non-resident tourists. c UNSD estimate. d Estimate. e ITU estimate. f Age<br />
group 15 to 44 years. g 1988. h Value is zero, not available or not applicable.<br />
168 World Statistics Pocketbook