

STATISTICS
LMTHw
LMTHw

You also want an ePaper? Increase the reach of your titles
YUMPU automatically turns print PDFs into web optimized ePapers that Google loves.
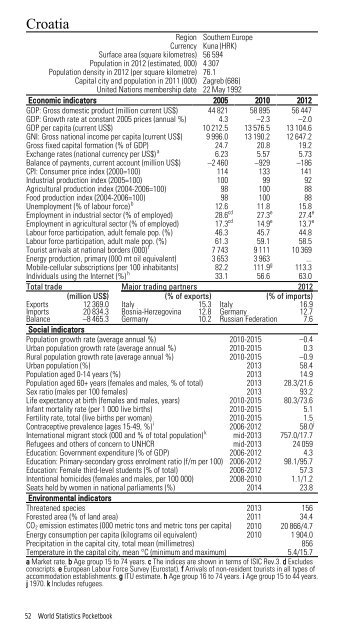
Croatia<br />
Region Southern Europe<br />
Currency Kuna (HRK)<br />
Surface area (square kilometres) 56 594<br />
Population in 2012 (estimated, 000) 4 307<br />
Population density in 2012 (per square kilometre) 76.1<br />
Capital city and population in 2011 (000) Zagreb (686)<br />
United Nations membership date 22 May 1992<br />
Economic indicators 2005 2010 2012<br />
GDP: Gross domestic product (million current US$) 44 821 58 895 56 447<br />
GDP: Growth rate at constant 2005 prices (annual %) 4.3 –2.3 –2.0<br />
GDP per capita (current US$) 10 212.5 13 576.5 13 104.6<br />
GNI: Gross national income per capita (current US$) 9 996.0 13 190.2 12 647.2<br />
Gross fixed capital formation (% of GDP) 24.7 20.8 19.2<br />
Exchange rates (national currency per US$) a 6.23 5.57 5.73<br />
Balance of payments, current account (million US$) –2 460 –929 –186<br />
CPI: Consumer price index (2000=100) 114 133 141<br />
Industrial production index (2005=100) 100 99 92<br />
Agricultural production index (2004-2006=100) 98 100 88<br />
Food production index (2004-2006=100) 98 100 88<br />
Unemployment (% of labour force) b 12.6 11.8 15.8<br />
Employment in industrial sector (% of employed) 28.6 cd 27.3 e 27.4 e<br />
Employment in agricultural sector (% of employed) 17.3 cd 14.9 e 13.7 e<br />
Labour force participation, adult female pop. (%) 46.3 45.7 44.8<br />
Labour force participation, adult male pop. (%) 61.3 59.1 58.5<br />
Tourist arrivals at national borders (000) f 7 743 9 111 10 369<br />
Energy production, primary (000 mt oil equivalent) 3 653 3 963 ...<br />
Mobile-cellular subscriptions (per 100 inhabitants) 82.2 111.9 g 113.3<br />
Individuals using the Internet (%) h 33.1 56.6 63.0<br />
Total trade Major trading partners 2012<br />
(million US$) (% of exports) (% of imports)<br />
Exports 12 369.0 Italy 15.3 Italy 16.9<br />
Imports 20 834.3 Bosnia-Herzegovina 12.8 Germany 12.7<br />
Balance –8 465.3 Germany 10.2 Russian Federation 7.6<br />
Social indicators<br />
Population growth rate (average annual %) 2010-2015 –0.4<br />
Urban population growth rate (average annual %) 2010-2015 0.3<br />
Rural population growth rate (average annual %) 2010-2015 –0.9<br />
Urban population (%) 2013 58.4<br />
Population aged 0-14 years (%) 2013 14.9<br />
Population aged 60+ years (females and males, % of total) 2013 28.3/21.6<br />
Sex ratio (males per 100 females) 2013 93.2<br />
Life expectancy at birth (females and males, years) 2010-2015 80.3/73.6<br />
Infant mortality rate (per 1 000 live births) 2010-2015 5.1<br />
Fertility rate, total (live births per woman) 2010-2015 1.5<br />
Contraceptive prevalence (ages 15-49, %) i 2006-2012 58.0 j<br />
International migrant stock (000 and % of total population) k mid-2013 757.0/17.7<br />
Refugees and others of concern to UNHCR mid-2013 24 059<br />
Education: Government expenditure (% of GDP) 2006-2012 4.3<br />
Education: Primary-secondary gross enrolment ratio (f/m per 100) 2006-2012 98.1/95.7<br />
Education: Female third-level students (% of total) 2006-2012 57.3<br />
Intentional homicides (females and males, per 100 000) 2008-2010 1.1/1.2<br />
Seats held by women in national parliaments (%) 2014 23.8<br />
Environmental indicators<br />
Threatened species 2013 156<br />
Forested area (% of land area) 2011 34.4<br />
CO 2 emission estimates (000 metric tons and metric tons per capita) 2010 20 866/4.7<br />
Energy consumption per capita (kilograms oil equivalent) 2010 1 904.0<br />
Precipitation in the capital city, total mean (millimetres) 856<br />
Temperature in the capital city, mean °C (minimum and maximum) 5.4/15.7<br />
a Market rate. b Age group 15 to 74 years. c The indices are shown in terms of ISIC Rev.3. d Excludes<br />
conscripts. e European Labour Force Survey (Eurostat). f Arrivals of non-resident tourists in all types of<br />
accommodation establishments. g ITU estimate. h Age group 16 to 74 years. i Age group 15 to 44 years.<br />
j 1970. k Includes refugees.<br />
52 World Statistics Pocketbook