

OTAGO MUSEUM
OtagoMuseum-1415-Annual-Report
OtagoMuseum-1415-Annual-Report

Create successful ePaper yourself
Turn your PDF publications into a flip-book with our unique Google optimized e-Paper software.
<strong>OTAGO</strong> <strong>MUSEUM</strong> TRUST BOARD<br />
NOTES TO THE FINANCIAL STATEMENTS (Cont.)<br />
For the Financial Year Ended 30 June, 2015<br />
22 FINANCIAL INSTRUMENTS cont.<br />
(g)<br />
Liquidity Risk Management<br />
Liquidity risk is the risk that the Museum will encounter difficulty in raising liquid funds to meets commitments as they fall<br />
due. Prudent liquidity risk management implies maintaining sufficient cash.<br />
The Museum manages liquidity risk by maintaining adequate funds on deposit, reserves, and banking facilities by<br />
continuously monitoring forecast and actual cash flows, and matching the maturity profiles of financial assets and liabilities.<br />
(h)<br />
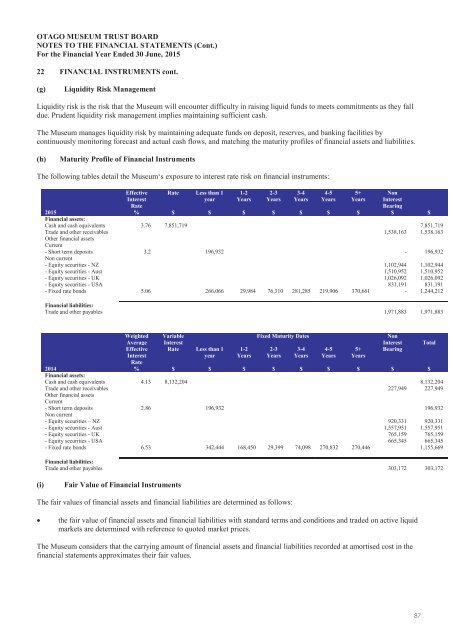
Maturity Profile of Financial Instruments<br />
The following tables detail the Museum‘s exposure to interest rate risk on financial instruments:<br />
Effective<br />
Interest<br />
Rate<br />
%<br />
Rate<br />
Less than 1<br />
year<br />
1-2<br />
Years<br />
2-3<br />
Years<br />
3-4<br />
Years<br />
4-5<br />
Years<br />
5+<br />
Years<br />
Non<br />
Interest<br />
Bearing<br />
$ $<br />
2015<br />
$<br />
$<br />
$ $ $ $ $<br />
Financial assets:<br />
Cash and cash equivalents 3.76 7,851,719 7,851,719<br />
Trade and other receivables 1,538,163 1,538,163<br />
Other financial assets<br />
Current<br />
- Short term deposits 3.2 196,932 - 196,932<br />
Non current<br />
- Equity securities - NZ 1,102,944 1,102,944<br />
- Equity securities - Aust 1,510,952 1,510,952<br />
- Equity securities - UK 1,026,092 1,026,092<br />
- Equity securities - USA 831,191 831,191<br />
- Fixed rate bonds 5.06 266,066 29,984 76,310 281,285 219,906 370,661 - 1,244,212<br />
Financial liabilities:<br />
Trade and other payables 1,971,883 1,971,883<br />
Weighted<br />
Average<br />
Effective<br />
Interest<br />
Rate<br />
%<br />
Variable<br />
Interest<br />
Rate<br />
Less than 1<br />
year<br />
1-2<br />
Years<br />
Fixed Maturity Dates<br />
2-3<br />
Years<br />
3-4<br />
Years<br />
4-5<br />
Years<br />
5+<br />
Years<br />
Non<br />
Interest<br />
Bearing<br />
2014<br />
$<br />
$<br />
$ $ $ $ $<br />
$ $<br />
Financial assets:<br />
Cash and cash equivalents 4.13 8,132,204 8,132,204<br />
Trade and other receivables 227,949 227,949<br />
Other financial assets<br />
Current<br />
- Short term deposits 2.86 196,932 196,932<br />
Non current<br />
- Equity securities – NZ 920,331 920,331<br />
- Equity securities - Aust 1,557,951 1,557,951<br />
- Equity securities - UK 765,159 765,159<br />
- Equity securities - USA 665,345 665,345<br />
- Fixed rate bonds 6.53 342,444 168,450 29,399 74,098 270,832 270,446 1,155,669<br />
Financial liabilities:<br />
Trade and other payables 303,172 303,172<br />
Total<br />
(i)<br />
Fair Value of Financial Instruments<br />
The fair values of financial assets and financial liabilities are determined as follows:<br />
<br />
the fair value of financial assets and financial liabilities with standard terms and conditions and traded on active liquid<br />
markets are determined with reference to quoted market prices.<br />
The Museum considers that the carrying amount of financial assets and financial liabilities recorded at amortised cost in the<br />
financial statements approximates their fair values.<br />
87