Hypostat 2015
On 30 September 2015, the EMF-ECBC published Hypostat 2015 , which is its main statistical report, encompassing data on recent developments in housing and mortgage markets in the EU28 and beyond. Hypostat is the result of a collaborative effort by the European Mortgage Federation’s national delegations and external experts. The publication covers 33 countries – i.e. the EU28 plus Iceland, Norway, Russia, Turkey and the United States.
On 30 September 2015, the EMF-ECBC published Hypostat 2015 , which is its main statistical report, encompassing data on recent developments in housing and mortgage markets in the EU28 and beyond. Hypostat is the result of a collaborative effort by the European Mortgage Federation’s national delegations and external experts.
The publication covers 33 countries – i.e. the EU28 plus Iceland, Norway, Russia, Turkey and the United States.

Create successful ePaper yourself
Turn your PDF publications into a flip-book with our unique Google optimized e-Paper software.
Housing and Mortgage Markets in 2014<br />
lower house prices. It is also true, in fact, that lower house prices take a toll on<br />
the economy as homeowners start to see their investment (the house) lose value,<br />
potentially compelling them to cut consumption and investments, thus fostering a<br />
vicious circle. The correlation is visible in a number of countries. See for instance<br />
Spain, chart 7. The European Central Bank in a paper of 2013 estimated that in Spain<br />
an increase of unemployment “has a negative and significant impact, -0.012 , while<br />
a contemporaneous change in the interest rates has no effect on house prices” 3 .<br />
CHART 8<br />
3,000,000<br />
2,500,000<br />
2,000,000<br />
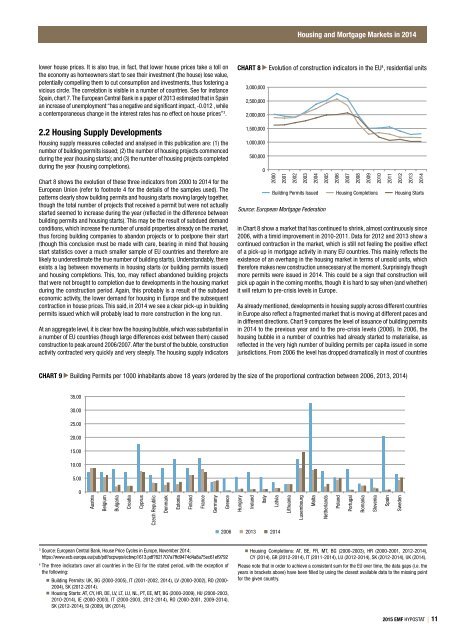
Evolution of construction indicators in the EU 4 , residential units<br />
2.2 Housing Supply Developments<br />
Housing supply measures collected and analysed in this publication are: (1) the<br />
number of building permits issued; (2) the number of housing projects commenced<br />
during the year (housing starts); and (3) the number of housing projects completed<br />
during the year (housing completions).<br />
Chart 8 shows the evolution of these three indicators from 2000 to 2014 for the<br />
European Union (refer to footnote 4 for the details of the samples used). The<br />
patterns clearly show building permits and housing starts moving largely together,<br />
though the total number of projects that received a permit but were not actually<br />
started seemed to increase during the year (reflected in the difference between<br />
building permits and housing starts). This may be the result of subdued demand<br />
conditions, which increase the number of unsold properties already on the market,<br />
thus forcing building companies to abandon projects or to postpone their start<br />
(though this conclusion must be made with care, bearing in mind that housing<br />
start statistics cover a much smaller sample of EU countries and therefore are<br />
likely to underestimate the true number of building starts). Understandably, there<br />
exists a lag between movements in housing starts (or building permits issued)<br />
and housing completions. This, too, may reflect abandoned building projects<br />
that were not brought to completion due to developments in the housing market<br />
during the construction period. Again, this probably is a result of the subdued<br />
economic activity, the lower demand for housing in Europe and the subsequent<br />
contraction in house prices. This said, in 2014 we see a clear pick-up in building<br />
permits issued which will probably lead to more construction in the long run.<br />
At an aggregate level, it is clear how the housing bubble, which was substantial in<br />
a number of EU countries (though large differences exist between them) caused<br />
construction to peak around 2006/2007. After the burst of the bubble, construction<br />
activity contracted very quickly and very steeply. The housing supply indicators<br />
1,500,000<br />
1,000,000<br />
500,000<br />
0<br />
2000<br />
2001<br />
2002<br />
2003<br />
2004<br />
2005<br />
2006<br />
2007<br />
2008<br />
2009<br />
2010<br />
2011<br />
2012<br />
2013<br />
2014<br />
Building Permits Issued<br />
Source: European Mortgage Federation<br />
Housing Completions<br />
Housing Starts<br />
in Chart 8 show a market that has continued to shrink, almost continuously since<br />
2006, with a timid improvement in 2010-2011. Data for 2012 and 2013 show a<br />
continued contraction in the market, which is still not feeling the positive effect<br />
of a pick-up in mortgage activity in many EU countries. This mainly reflects the<br />
existence of an overhang in the housing market in terms of unsold units, which<br />
therefore makes new construction unnecessary at the moment. Surprisingly though<br />
more permits were issued in 2014. This could be a sign that construction will<br />
pick up again in the coming months, though it is hard to say when (and whether)<br />
it will return to pre-crisis levels in Europe.<br />
As already mentioned, developments in housing supply across different countries<br />
in Europe also reflect a fragmented market that is moving at different paces and<br />
in different directions. Chart 9 compares the level of issuance of building permits<br />
in 2014 to the previous year and to the pre-crisis levels (2006). In 2006, the<br />
housing bubble in a number of countries had already started to materialise, as<br />
reflected in the very high number of building permits per capita issued in some<br />
jurisdictions. From 2006 the level has dropped dramatically in most of countries<br />
CHART 9 Building Permits per 1000 inhabitants above 18 years (ordered by the size of the proportional contraction between 2006, 2013, 2014)<br />
35.00<br />
30.00<br />
25.00<br />
20.00<br />
15.00<br />
10.00<br />
5.00<br />
0<br />
Austria<br />
Belgium<br />
Bulgaria<br />
Croatia<br />
Cyprus<br />
Czech Republic<br />
Denmark<br />
Estonia<br />
Finland<br />
France<br />
Germany<br />
Greece<br />
Hungary<br />
Ireland<br />
Italy<br />
Latvia<br />
Lithuania<br />
Luxembourg<br />
Malta<br />
Netherlands<br />
Poland<br />
Portugal<br />
Romania<br />
Slovenia<br />
Spain<br />
Sweden<br />
2006 2013 2014<br />
3<br />
Source: European Central Bank, House Price Cycles in Europe, November 2014;<br />
https://www.ecb.europa.eu/pub/pdf/scpwps/ecbwp1613.pdf?821707a7ffd9474d4a8a75ec61ef9792<br />
4<br />
The three indicators cover all countries in the EU for the stated period, with the exception of<br />
the following:<br />
Building Permits: UK, BG (2000-2005), IT (2001-2002, 2014), LV (2000-2002), RO (2000-<br />
2004), SK (2012-2014).<br />
Housing Starts: AT, CY, HR, DE, LV, LT, LU, NL, PT, EE, MT, BG (2000-2009), HU (2000-2003,<br />
2010-2014), IE (2000-2003), IT (2000-2003, 2012-2014), RO (2000-2001, 2009-2014),<br />
SK (2012-2014), SI (2009), UK (2014).<br />
Housing Completions: AT, BE, FR, MT, BG (2000-2003), HR (2000-2001, 2012-2014),<br />
CY (2014), GR (2012-2014), IT (2011-2014), LU (2012-2014), SK (2012-2014), UK (2014).<br />
Please note that in order to achieve a consistent sum for the EU over time, the data gaps (i.e. the<br />
years in brackets above) have been filled by using the closest available data to the missing point<br />
for the given country.<br />
<strong>2015</strong> EMF HYPOSTAT | 11