Hypostat 2015
On 30 September 2015, the EMF-ECBC published Hypostat 2015 , which is its main statistical report, encompassing data on recent developments in housing and mortgage markets in the EU28 and beyond. Hypostat is the result of a collaborative effort by the European Mortgage Federation’s national delegations and external experts. The publication covers 33 countries – i.e. the EU28 plus Iceland, Norway, Russia, Turkey and the United States.
On 30 September 2015, the EMF-ECBC published Hypostat 2015 , which is its main statistical report, encompassing data on recent developments in housing and mortgage markets in the EU28 and beyond. Hypostat is the result of a collaborative effort by the European Mortgage Federation’s national delegations and external experts.
The publication covers 33 countries – i.e. the EU28 plus Iceland, Norway, Russia, Turkey and the United States.

You also want an ePaper? Increase the reach of your titles
YUMPU automatically turns print PDFs into web optimized ePapers that Google loves.
Statistical Tables – The Mortgage Market<br />
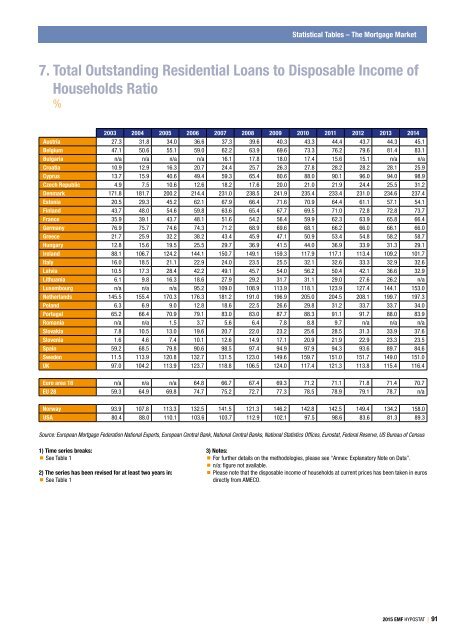
7. Total Outstanding Residential Loans to Disposable Income of<br />
Households Ratio<br />
%<br />
2003 2004 2005 2006 2007 2008 2009 2010 2011 2012 2013 2014<br />
Austria 27.3 31.8 34.0 36.6 37.3 39.6 40.3 43.3 44.4 43.7 44.3 45.1<br />
Belgium 47.1 50.6 55.1 59.0 62.2 63.9 69.6 73.3 76.2 79.6 81.4 83.1<br />
Bulgaria n/a n/a n/a n/a 16.1 17.8 18.0 17.4 15.6 15.1 n/a n/a<br />
Croatia 10.9 12.9 16.3 20.7 24.4 25.7 26.3 27.8 28.2 28.2 28.1 25.9<br />
Cyprus 13.7 15.9 40.6 49.4 59.3 65.4 80.6 88.0 90.1 96.0 94.0 98.9<br />
Czech Republic 4.9 7.5 10.6 12.6 18.2 17.6 20.0 21.0 21.9 24.4 25.5 31.2<br />
Denmark 171.8 181.7 200.2 214.4 231.0 238.5 241.9 235.4 233.4 231.0 234.6 237.4<br />
Estonia 20.5 29.3 45.2 62.1 67.9 66.4 71.6 70.9 64.4 61.1 57.1 54.1<br />
Finland 43.7 48.0 54.6 59.8 63.6 65.4 67.7 69.5 71.0 72.8 72.8 73.7<br />
France 35.9 39.1 43.7 48.1 51.6 54.2 56.4 59.9 62.3 63.9 65.8 66.4<br />
Germany 76.9 75.7 74.6 74.3 71.2 68.9 69.6 68.1 66.2 66.0 66.1 66.0<br />
Greece 21.7 25.9 32.2 38.2 43.4 45.9 47.1 50.9 53.4 54.8 58.2 58.7<br />
Hungary 12.8 15.6 19.5 25.5 29.7 36.9 41.5 44.0 36.9 33.9 31.3 29.1<br />
Ireland 88.1 106.7 124.2 144.1 150.7 149.1 159.3 117.9 117.1 113.4 109.2 101.7<br />
Italy 16.0 18.5 21.1 22.9 24.0 23.5 25.5 32.1 32.6 33.3 32.9 32.6<br />
Latvia 10.5 17.3 28.4 42.2 49.1 45.7 54.0 56.2 50.4 42.1 36.6 32.9<br />
Lithuania 6.1 9.8 16.3 18.6 27.9 29.2 31.7 31.1 29.0 27.6 26.2 n/a<br />
Luxembourg n/a n/a n/a 95.2 109.0 108.9 113.9 118.1 123.9 127.4 144.1 153.0<br />
Netherlands 145.5 155.4 170.3 176.3 181.2 191.0 196.9 205.0 204.5 208.1 199.7 197.3<br />
Poland 6.3 6.9 9.0 12.8 18.6 22.5 26.6 29.8 31.2 33.7 33.7 34.0<br />
Portugal 65.2 66.4 70.9 79.1 83.0 83.0 87.7 88.3 91.1 91.7 88.0 83.9<br />
Romania n/a n/a 1.5 3.7 5.6 6.4 7.8 8.8 9.7 n/a n/a n/a<br />
Slovakia 7.8 10.5 13.0 19.6 20.7 22.0 23.2 25.6 28.5 31.3 33.9 37.6<br />
Slovenia 1.6 4.6 7.4 10.1 12.6 14.9 17.1 20.9 21.9 22.9 23.3 23.5<br />
Spain 59.2 68.5 79.8 90.6 98.5 97.4 94.9 97.9 94.3 93.6 89.7 84.6<br />
Sweden 11.5 113.9 120.8 132.7 131.5 123.0 149.6 159.7 151.0 151.7 149.0 151.0<br />
UK 97.0 104.2 113.9 123.7 118.8 106.5 124.0 117.4 121.3 113.8 115.4 116.4<br />
Euro area 18 n/a n/a n/a 64.8 66.7 67.4 69.3 71.2 71.1 71.8 71.4 70.7<br />
EU 28 59.3 64.9 69.8 74.7 75.2 72.7 77.3 78.5 78.9 79.1 78.7 n/a<br />
Norway 93.9 107.8 113.3 132.5 141.5 121.3 146.2 142.8 142.5 149.4 134.2 158.0<br />
USA 80.4 88.0 110.1 103.6 103.7 112.9 102.1 97.5 98.6 83.6 81.3 89.3<br />
Source: European Mortgage Federation National Experts, European Central Bank, National Central Banks, National Statistics Offices, Eurostat, Federal Reserve, US Bureau of Census<br />
1) Time series breaks:<br />
See Table 1<br />
2) The series has been revised for at least two years in:<br />
See Table 1<br />
3) Notes:<br />
For further details on the methodologies, please see “Annex: Explanatory Note on Data”.<br />
n/a: figure not available.<br />
Please note that the disposable income of households at current prices has been taken in euros<br />
directly from AMECO.<br />
<strong>2015</strong> EMF HYPOSTAT | 91