Hypostat 2015
On 30 September 2015, the EMF-ECBC published Hypostat 2015 , which is its main statistical report, encompassing data on recent developments in housing and mortgage markets in the EU28 and beyond. Hypostat is the result of a collaborative effort by the European Mortgage Federation’s national delegations and external experts. The publication covers 33 countries – i.e. the EU28 plus Iceland, Norway, Russia, Turkey and the United States.
On 30 September 2015, the EMF-ECBC published Hypostat 2015 , which is its main statistical report, encompassing data on recent developments in housing and mortgage markets in the EU28 and beyond. Hypostat is the result of a collaborative effort by the European Mortgage Federation’s national delegations and external experts.
The publication covers 33 countries – i.e. the EU28 plus Iceland, Norway, Russia, Turkey and the United States.

Create successful ePaper yourself
Turn your PDF publications into a flip-book with our unique Google optimized e-Paper software.
Housing and Mortgage Markets in 2014<br />
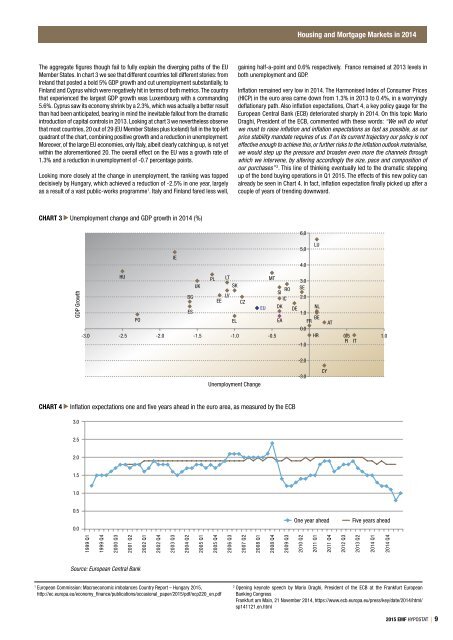
The aggregate figures though fail to fully explain the diverging paths of the EU<br />
Member States. In chart 3 we see that different countries tell different stories: from<br />
Ireland that posted a bold 5% GDP growth and cut unemployment substantially, to<br />
Finland and Cyprus which were negatively hit in terms of both metrics. The country<br />
that experienced the largest GDP growth was Luxembourg with a commanding<br />
5.6%. Cyprus saw its economy shrink by a 2.3%, which was actually a better result<br />
than had been anticipated, bearing in mind the inevitable fallout from the dramatic<br />
introduction of capital controls in 2013. Looking at chart 3 we nevertheless observe<br />
that most countries, 20 out of 29 (EU Member States plus Iceland) fall in the top left<br />
quadrant of the chart, combining positive growth and a reduction in unemployment.<br />
Moreover, of the large EU economies, only Italy, albeit clearly catching up, is not yet<br />
within the aforementioned 20. The overall effect on the EU was a growth rate of<br />
1.3% and a reduction in unemployment of -0.7 percentage points.<br />
Looking more closely at the change in unemployment, the ranking was topped<br />
decisively by Hungary, which achieved a reduction of -2.5% in one year, largely<br />
as a result of a vast public-works programme 1 . Italy and Finland fared less well,<br />
gaining half-a-point and 0.6% respectively. France remained at 2013 levels in<br />
both unemployment and GDP.<br />
Inflation remained very low in 2014. The Harmonised Index of Consumer Prices<br />
(HICP) in the euro area came down from 1.3% in 2013 to 0.4%, in a worryingly<br />
deflationary path. Also inflation expectations, Chart 4, a key policy gauge for the<br />
European Central Bank (ECB) deteriorated sharply in 2014. On this topic Mario<br />
Draghi, President of the ECB, commented with these words: “We will do what<br />
we must to raise inflation and inflation expectations as fast as possible, as our<br />
price stability mandate requires of us. If on its current trajectory our policy is not<br />
effective enough to achieve this, or further risks to the inflation outlook materialise,<br />
we would step up the pressure and broaden even more the channels through<br />
which we intervene, by altering accordingly the size, pace and composition of<br />
our purchases” 2 . This line of thinking eventually led to the dramatic stepping<br />
up of the bond buying operations in Q1 <strong>2015</strong>. The effects of this new policy can<br />
already be seen in Chart 4. In fact, inflation expectation finally picked up after a<br />
couple of years of trending downward.<br />
CHART 3 Unemployment change and GDP growth in 2014 (%)<br />
ie<br />
6,0<br />
5,0<br />
4.0<br />
lu<br />
GDP Growth<br />
HU<br />
PL lt<br />
mt<br />
3.0<br />
UK<br />
sk<br />
ro se<br />
bG<br />
ee lv<br />
si<br />
ic 2.0<br />
cz<br />
eu dk<br />
de<br />
nl<br />
es<br />
1.0<br />
PO<br />
be<br />
EL<br />
ea fr at<br />
0.0<br />
-3.0 -2.5 -2.0 -1.5 -1.0 -0.5 Hr 0.5 1.0<br />
fi it<br />
-1.0<br />
-2.0<br />
Unemployment Change<br />
-3.0<br />
cy<br />
CHART 4<br />
Inflation expectations one and five years ahead in the euro area, as measured by the ECB<br />
3.0<br />
2.5<br />
2.0<br />
1.5<br />
1.0<br />
0.5<br />
0.0<br />
One year ahead<br />
Five years ahead<br />
1999 Q1<br />
1999 Q4<br />
2000 Q3<br />
2001 Q2<br />
2002 Q1<br />
2002 Q4<br />
2003 Q3<br />
2004 Q2<br />
2005 Q1<br />
2005 Q4<br />
2006 Q3<br />
2007 Q2<br />
2008 Q1<br />
2008 Q4<br />
2009 Q3<br />
2010 Q2<br />
2011 Q1<br />
2011 Q4<br />
2012 Q3<br />
2013 Q2<br />
2014 Q1<br />
2014 Q4<br />
Source: European Central Bank<br />
1<br />
European Commission: Macroeconomic imbalances Country Report – Hungary <strong>2015</strong>,<br />
http://ec.europa.eu/economy_finance/publications/occasional_paper/<strong>2015</strong>/pdf/ocp220_en.pdf<br />
2<br />
Opening keynote speech by Mario Draghi, President of the ECB at the Frankfurt European<br />
Banking Congress<br />
Frankfurt am Main, 21 November 2014, https://www.ecb.europa.eu/press/key/date/2014/html/<br />
sp141121.en.html<br />
<strong>2015</strong> EMF HYPOSTAT | 9