


You also want an ePaper? Increase the reach of your titles
YUMPU automatically turns print PDFs into web optimized ePapers that Google loves.
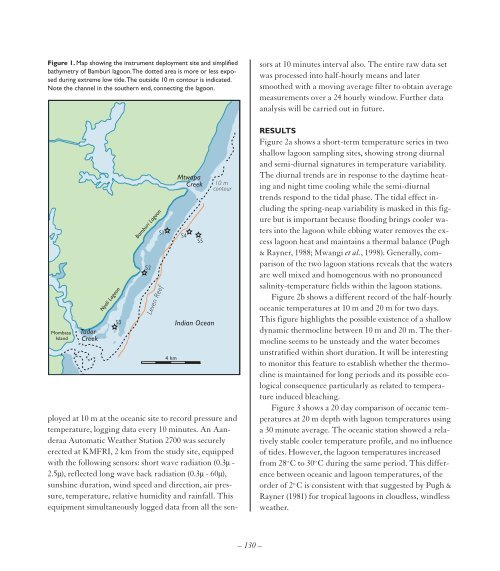
Figure 1. Map showing the instrument deployment site and simplified<br />
bathymetry of Bamburi lagoon. The dotted area is more or less exposed<br />
during extreme low tide. The outside 10 m contour is indicated.<br />
Note the channel in the southern end, connecting the lagoon.<br />
sors at 10 minutes interval also. The entire raw data set<br />
was processed into half-hourly means and later<br />
smoothed with a moving average filter to obtain average<br />
measurements over a 24 hourly window. Further data<br />
analysis will be carried out in future.<br />
ployed at 10 m at the oceanic site to record pressure and<br />
temperature, logging data every 10 minutes. An Aanderaa<br />
Automatic Weather Station 2700 was securely<br />
erected at KMFRI, 2 km from the study site, equipped<br />
with the following sensors: short wave radiation (0.3µ -<br />
2.5µ), reflected long wave back radiation (0.3µ - 60µ),<br />
sunshine duration, wind speed and direction, air pressure,<br />
temperature, relative humidity and rainfall. This<br />
equipment simultaneously logged data from all the sen-<br />
RESULTS<br />
Figure 2a shows a short-term temperature series in two<br />
shallow lagoon sampling sites, showing strong diurnal<br />
and semi-diurnal signatures in temperature variability.<br />
The diurnal trends are in response to the daytime heating<br />
and night time cooling while the semi-diurnal<br />
trends respond to the tidal phase. The tidal effect including<br />
the spring-neap variability is masked in this figure<br />
but is important because flooding brings cooler waters<br />
into the lagoon while ebbing water removes the excess<br />
lagoon heat and maintains a thermal balance (Pugh<br />
& Rayner, 1988; Mwangi et al., 1998). Generally, comparison<br />
of the two lagoon stations reveals that the waters<br />
are well mixed and homogenous with no pronounced<br />
salinity-temperature fields within the lagoon stations.<br />
Figure 2b shows a different record of the half-hourly<br />
oceanic temperatures at 10 m and 20 m for two days.<br />
This figure highlights the possible existence of a shallow<br />
dynamic thermocline between 10 m and 20 m. The thermocline<br />
seems to be unsteady and the water becomes<br />
unstratified within short duration. It will be interesting<br />
to monitor this feature to establish whether the thermocline<br />
is maintained for long periods and its possible ecological<br />
consequence particularly as related to temperature<br />
induced bleaching.<br />
Figure 3 shows a 20 day comparison of oceanic temperatures<br />
at 20 m depth with lagoon temperatures using<br />
a 30 minute average. The oceanic station showed a relatively<br />
stable cooler temperature profile, and no influence<br />
of tides. However, the lagoon temperatures increased<br />
from 28 o C to 30 o C during the same period. This difference<br />
between oceanic and lagoon temperatures, of the<br />
order of 2 o C is consistent with that suggested by Pugh &<br />
Rayner (1981) for tropical lagoons in cloudless, windless<br />
weather.<br />
– 130 –


