- Page 1:
Connecting Global Priorities: Biodi
- Page 4 and 5:
WHO Library Cataloguing-in-Publicat
- Page 6 and 7:
Chapter authors Lead coordinating a
- Page 8 and 9:
Table of Contents Forewords _______
- Page 10 and 11:
11. Traditional medicine___________
- Page 12 and 13:
Foreword by the Director, Public He
- Page 14 and 15:
Biodiversity and Health “is a sta
- Page 17 and 18:
GLEN BOWES Executive Summary INTROD
- Page 19 and 20:
Multi-disciplinary research and app
- Page 21 and 22:
BIODIVERSITY, FOOD PRODUCTION AND N
- Page 23 and 24:
of wild foods increases during the
- Page 25 and 26:
most rapid increase in low- and mid
- Page 27 and 28:
human outbreaks, suggesting a senti
- Page 29 and 30:
purposes. These pose a threat both
- Page 31 and 32:
art, literature and dance. They for
- Page 33 and 34: AIRMAN 1ST CLASS CHERYL SANZI (USAF
- Page 35 and 36: through, inter alia, better underst
- Page 37 and 38: Others include identifying and redu
- Page 39 and 40: PART I Concepts, Themes & Direction
- Page 41 and 42: and experts from the fields of biod
- Page 43 and 44: Linkages and co-dependencies at the
- Page 45 and 46: “species richness” is one of bi
- Page 47 and 48: Box 1. A typology of biodiversity-h
- Page 49 and 50: adequate responses targeting specif
- Page 51 and 52: ASIAN DEVELOPMENT BANK / FLICKR eco
- Page 53 and 54: processes and associated thresholds
- Page 55 and 56: Land-use change is also the leading
- Page 57 and 58: Much of the natural and migration g
- Page 59 and 60: 6. CONCLUSION: A THEMATIC APPROACH
- Page 61 and 62: PART II Thematic Areas in Biodivers
- Page 63 and 64: 2. Water resources: an essential ec
- Page 65 and 66: Box 1. The Catskills: an ecosystem
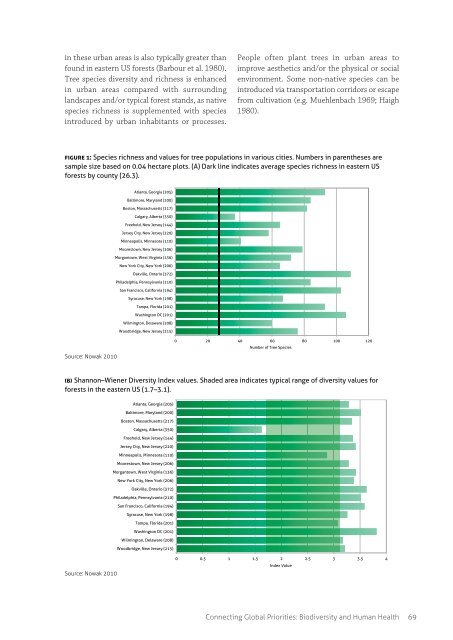
- Page 67 and 68: • increased biomass of phytoplank
- Page 69 and 70: or to increase the growth rate of a
- Page 71 and 72: 2002). Integrated water management
- Page 73 and 74: valuable benefits to human communit
- Page 75 and 76: In Cameroon, schistosomiasis has be
- Page 77 and 78: have been relatively successful wit
- Page 79 and 80: UNDP BANGLADESH / FLICKR 4. Biodive
- Page 81 and 82: summer (e.g. to cool buildings), in
- Page 83: Emissions occur primarily under con
- Page 87 and 88: spp.), oak (Quercus spp.), black lo
- Page 89 and 90: (S)-containing pollutants. Species
- Page 91 and 92: CRAIG HANSEN 5. Agricultural biodiv
- Page 93 and 94: Box 1. Risks to animal genetic reso
- Page 95 and 96: With land conversion has come signi
- Page 97 and 98: 2001; Wilby et al. 2009; Frison et
- Page 99 and 100: of spiders (important pest predator
- Page 101 and 102: • Oncogenic effects: tumour-formi
- Page 103 and 104: have been pesticides of many differ
- Page 105 and 106: integrated pest management (IPM), i
- Page 107 and 108: the world (PAR/FAO 2011). Despite p
- Page 109 and 110: Declaration which particularly invo
- Page 111 and 112: most likely to be negatively impact
- Page 113 and 114: RAWPIXEL LTD 6. Biodiversity and Nu
- Page 115 and 116: In view of these trends, monitoring
- Page 117 and 118: Table 1: Carotenoid content of sele
- Page 119 and 120: intakes of these nutrients and rela
- Page 121 and 122: een shown to stimulate productivity
- Page 123 and 124: 4. Wild foods and human nutrition 3
- Page 125 and 126: some parts of the world. For exampl
- Page 127 and 128: depletion of some species (Nasi et
- Page 129 and 130: and how these foods can be used to
- Page 131 and 132: Results from the Philippine Nationa
- Page 133 and 134: 7. Nutrition, biodiversity and agri
- Page 135 and 136:
eeds sold at farmer’s markets aro
- Page 137 and 138:
& Haider 2015). In Indonesia, the C
- Page 139 and 140:
products and directing them to publ
- Page 141 and 142:
Substitutes (WHO 1981). Text from t
- Page 143 and 144:
malnutrition in all its forms and t
- Page 145 and 146:
RAWPIXEL LTD / ISTOCKPHOTO novel, i
- Page 147 and 148:
population increases, over five bil
- Page 149 and 150:
of low competence (“diluting”)
- Page 151 and 152:
fragmentation. A recent review inve
- Page 153 and 154:
een removed from these areas, the v
- Page 155 and 156:
contact and pathogen transmission o
- Page 157 and 158:
number of cases has dramatically in
- Page 159 and 160:
Genetic diversity within such culti
- Page 161 and 162:
and the evolution of a more suitabl
- Page 163 and 164:
assessments - including wildlife di
- Page 165 and 166:
monkey. If non-human primates are h
- Page 167 and 168:
contributing to diminished immunore
- Page 169 and 170:
helminth that could be administered
- Page 171 and 172:
components in house dust was associ
- Page 173 and 174:
4..1 etriental irobiota in unhealth
- Page 175 and 176:
In low-income settings, exposure to
- Page 177 and 178:
KIBAE PARK / UNITED NATION PHOTO /
- Page 179 and 180:
a) Traditional versus microbiota-da
- Page 181 and 182:
development for use in the US. Most
- Page 183 and 184:
Case study: herus auatius and DNA r
- Page 185 and 186:
In the coming decades, a great mass
- Page 187 and 188:
Box 1. Overview of some of the majo
- Page 189 and 190:
attention only in recent years, as
- Page 191 and 192:
APIs with similar modes of action)
- Page 193 and 194:
several potential knock-in impacts
- Page 195 and 196:
widespread use (Boxall et al. 2012)
- Page 197 and 198:
environments, and is usually passed
- Page 199 and 200:
in cats claw is so immense that, in
- Page 201 and 202:
among healers and act according to
- Page 203 and 204:
Box 4. Therapeutic and sacred lands
- Page 205 and 206:
(PROMETRA),⁵ which has been worki
- Page 207 and 208:
Box 5: Participatory approaches to
- Page 209 and 210:
The case of the RITAM initiative (i
- Page 211 and 212:
esources and equitable sharing of b
- Page 213 and 214:
6.1 Innovations and incentives It i
- Page 215 and 216:
These cases highlight that promotin
- Page 217 and 218:
we interact with other life forms i
- Page 219 and 220:
health benefits of exposure to gree
- Page 221 and 222:
3. Biodiversity, green space, exerc
- Page 223 and 224:
NCDs and their risk factors can be
- Page 225 and 226:
al. (2012) and Fuller et al. (2007)
- Page 227 and 228:
UNITED NATIONS PHOTO / FLICKR Recog
- Page 229 and 230:
While many community-specific linka
- Page 231 and 232:
Therapeutic and biocultural landsca
- Page 233 and 234:
Box 6. Ko Omapere te wai, Aotearoa
- Page 235 and 236:
The high biodiversity ecosystems wi
- Page 237 and 238:
PART III Cross-Cutting Issues, Tool
- Page 239 and 240:
The chapters in this volume have dr
- Page 241 and 242:
al. 2014), though advances in techn
- Page 243 and 244:
2. Climate change challenges at the
- Page 245 and 246:
adaptation and mitigation strategie
- Page 247 and 248:
Box 2 discusses the impact of heat
- Page 249 and 250:
.5.1 ountain eosstes and liate hang
- Page 251 and 252:
poor and vulnerable communities, in
- Page 253 and 254:
Women (MDD-W), which has been sugge
- Page 255 and 256:
displacement, injury, or loss of so
- Page 257 and 258:
enhance preparedness towards the ad
- Page 259 and 260:
Case study: The use of vegetation i
- Page 261 and 262:
While community members and visitor
- Page 263 and 264:
from local forests, while wild food
- Page 265 and 266:
Case study: Pressure on water resou
- Page 267 and 268:
STEPHAN BACHENHEIMER / WORLD BANK P
- Page 269 and 270:
unwanted pregnancies, and the imple
- Page 271 and 272:
Business-as-usual scenarios were co
- Page 273 and 274:
industrial food production systems
- Page 275 and 276:
Table 1 : Some key biodiversity-hea
- Page 277 and 278:
(f) Addressing the unintended negat
- Page 279 and 280:
intersectoral collaboration on biod
- Page 281 and 282:
Ecosystem Assessment, is a framewor
- Page 283 and 284:
Table 2: Examples of cross-cutting
- Page 285 and 286:
7. Shaping behaviour and engaging c
- Page 287 and 288:
execution techniques; this is the a
- Page 289 and 290:
“reduce biodiversity loss, achiev
- Page 291 and 292:
antagonistic effects of complementa
- Page 293 and 294:
Folke, C. (2006). Resilience: the e
- Page 295 and 296:
United Nations Task Team on Social
- Page 297 and 298:
Drace, K.; Kiefer, A. M.; Veiga, M.
- Page 299 and 300:
Oliver, D.M., Heathwaite, L., Hayga
- Page 301 and 302:
WWF. (2012). Living Planet Report 2
- Page 303 and 304:
Nowak D.J., Hirabayashi S., et al.
- Page 305 and 306:
CBD (2014) Emerging key messages fo
- Page 307 and 308:
Halwart, M. (2013) Valuing aquatic
- Page 309 and 310:
Micronutrient Initiative (2009) Inv
- Page 311 and 312:
Smith, P. and M. Bustamante (2013)
- Page 313 and 314:
Barnes, K.K., Collins, T.A., Dion,
- Page 315 and 316:
Elyse Messer, A. (2015) World crop
- Page 317 and 318:
Hooper, D. U. , F. S. Chapin III, J
- Page 319 and 320:
McDermott, J., Johnson, N., Kadiyal
- Page 321 and 322:
Schulp, C.J.E., Thuiller, W. and Ve
- Page 323 and 324:
WHO (2012a). Obesity and Overweight
- Page 325 and 326:
Dornelas, M., Gotelli, N. J., McGil
- Page 327 and 328:
Mack, R., Simberloff D., Lonsdale W
- Page 329 and 330:
Suzán, G., Marcé, E., Giermakowsk
- Page 331 and 332:
Ege MJ, Mayer M, Normand AC, Genune
- Page 333 and 334:
O’Byrne KJ, Dalgleish AG, Brownin
- Page 335 and 336:
Zeeuwen PL, Kleerebezem M, Timmerma
- Page 337 and 338:
Floate KD, Wardhaugh KG, Boxall ABA
- Page 339 and 340:
Bertrand Graz, Healing and preventi
- Page 341 and 342:
Unnikrishnan, P.M., Prakash, B.N. (
- Page 343 and 344:
Ellett, L., Freeman, D., Garety, P.
- Page 345 and 346:
Mitchell, R., Popham, F. (2008) Eff
- Page 347 and 348:
Williams, D. R., & Huffman, M. G. (
- Page 349 and 350:
Eriksson, M., Jianchu, X., Shrestha
- Page 351 and 352:
Parmesan, C., & Martens, P. (2009).
- Page 353 and 354:
Das, S. and Crépin, A-S. 2013. Man
- Page 355 and 356:
Sudmeier-Rieux, K. and Ash, N. (200
- Page 357 and 358:
Robbins, P. (2011). Political ecolo
- Page 359 and 360:
Golden S. D., Earp J. A. (2012). So
- Page 364:
Secretariat of the Convention on Bi