in the 21st Century
hTOE305aYVW
hTOE305aYVW

Create successful ePaper yourself
Turn your PDF publications into a flip-book with our unique Google optimized e-Paper software.
28 Kenya’s F<strong>in</strong>ancial Transformation <strong>in</strong> <strong>the</strong> <strong>21st</strong> <strong>Century</strong><br />
1993, peaked at 85% <strong>in</strong> July 1993, and <strong>the</strong>n dropped steadily but rema<strong>in</strong>ed<br />
still very high at 44% <strong>in</strong> December 1993. 23<br />
This liberalisation of <strong>in</strong>terest rates and exchange rates provided fur<strong>the</strong>r avenues<br />
for local banks to compete with more established banks, and was an added<br />
stimulus for local bank entry (Brownbridge, 1998; Ndung’u and Ngugi, 1999).<br />
While <strong>the</strong> 1980s witnessed <strong>the</strong> rise of African (ma<strong>in</strong>ly Kikuyu) banks, <strong>the</strong> late<br />
1980s and 1990s witnessed <strong>the</strong> rise of several African (Kalenj<strong>in</strong>) and Asian-<br />
African banks. 24 By <strong>the</strong> mid-1990s, it is estimated that local banks controlled<br />
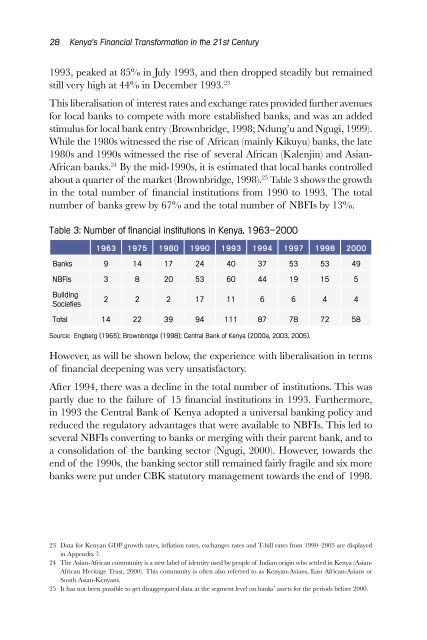
about a quarter of <strong>the</strong> market (Brownbridge, 1998). 25 Table 3 shows <strong>the</strong> growth<br />
<strong>in</strong> <strong>the</strong> total number of f<strong>in</strong>ancial <strong>in</strong>stitutions from 1990 to 1993. The total<br />
number of banks grew by 67% and <strong>the</strong> total number of NBFIs by 13%.<br />
Table 3: Number of f<strong>in</strong>ancial <strong>in</strong>stitutions <strong>in</strong> Kenya, 1963–2000<br />
1963 1975 1980 1990 1993 1994 1997 1998 2000<br />
Banks 9 14 17 24 40 37 53 53 49<br />
NBFIs 3 8 20 53 60 44 19 15 5<br />
Build<strong>in</strong>g<br />
Societies<br />
2 2 2 17 11 6 6 4 4<br />
Total 14 22 39 94 111 87 78 72 58<br />
Source: Engberg (1965); Brownbridge (1998); Central Bank of Kenya (2000a, 2003, 2005).<br />
However, as will be shown below, <strong>the</strong> experience with liberalisation <strong>in</strong> terms<br />
of f<strong>in</strong>ancial deepen<strong>in</strong>g was very unsatisfactory.<br />
After 1994, <strong>the</strong>re was a decl<strong>in</strong>e <strong>in</strong> <strong>the</strong> total number of <strong>in</strong>stitutions. This was<br />
partly due to <strong>the</strong> failure of 15 f<strong>in</strong>ancial <strong>in</strong>stitutions <strong>in</strong> 1993. Fur<strong>the</strong>rmore,<br />
<strong>in</strong> 1993 <strong>the</strong> Central Bank of Kenya adopted a universal bank<strong>in</strong>g policy and<br />
reduced <strong>the</strong> regulatory advantages that were available to NBFIs. This led to<br />
several NBFIs convert<strong>in</strong>g to banks or merg<strong>in</strong>g with <strong>the</strong>ir parent bank, and to<br />
a consolidation of <strong>the</strong> bank<strong>in</strong>g sector (Ngugi, 2000). However, towards <strong>the</strong><br />
end of <strong>the</strong> 1990s, <strong>the</strong> bank<strong>in</strong>g sector still rema<strong>in</strong>ed fairly fragile and six more<br />
banks were put under CBK statutory management towards <strong>the</strong> end of 1998.<br />
23 Data for Kenyan GDP growth rates, <strong>in</strong>flation rates, exchanges rates and T-bill rates from 1990–2005 are displayed<br />
<strong>in</strong> Appendix 7.<br />
24 The Asian-African community is a new label of identity used by people of Indian orig<strong>in</strong> who settled <strong>in</strong> Kenya (Asian-<br />
African Heritage Trust, 2000). This community is often also referred to as Kenyan-Asians, East African-Asians or<br />
South Asian-Kenyans.<br />
25 It has not been possible to get disaggregated data at <strong>the</strong> segment level on banks’ assets for <strong>the</strong> periods before 2000.