INTRODUCTORY SPECIAL INTRODUCTORY ... - PHOTON Info
INTRODUCTORY SPECIAL INTRODUCTORY ... - PHOTON Info
INTRODUCTORY SPECIAL INTRODUCTORY ... - PHOTON Info

Create successful ePaper yourself
Turn your PDF publications into a flip-book with our unique Google optimized e-Paper software.
Rolf Schulten / photon-pictures.com<br />
Politics<br />
investment for homeowners: it depends<br />
greatly on the state in which the consum-<br />
er lives. That’s because the five key factors<br />
mentioned above differ significantly from<br />
state to state. To gain insight into these key<br />
factors, <strong>PHOTON</strong> has collected and evalu-<br />
ated market data from all 50 states, and<br />
conducted interviews with solar financial<br />
analysts. The general consensus is that 13<br />
states currently offer good financial condi-<br />
tions for buying a residential PV system.<br />
To get a better handle on the situation in<br />
these 13 »solar colonies,« we calculated the<br />
internal rate of return – a common met-<br />
ric for measuring the attractiveness of an<br />
investment – for going solar in the states<br />
(see graph page 30). Although we didn’t<br />
perform any calculations for the other 37<br />
states, current data, in particular electric-<br />
ity prices and incentives, suggests that<br />
buying a PV system would not yield a good<br />
return in these states. But that could easily<br />
change in the near future.<br />
Finally, we must make an important<br />
caveat when presenting state by state com-<br />
parisons of solar financial conditions: the<br />
factors driving your return can vary not<br />
only by state, but by your utility company.<br />
Moreover, it can even vary customer to<br />
customer – i.e. your next-door neighbor<br />
could have a better or worse return on in-<br />
vestment than you.<br />
How sunny is your state?<br />
Not surprisingly, the amount of sun-<br />
light where you live has a significant in-<br />
fluence on how well the PV system on your<br />
roof will perform – in other words, how<br />
many kWh your system will crank out per<br />
unit of time. This, in turn, determines how<br />
much electricity you will avoid having to<br />
purchase from your utility, and there-<br />
fore how much money you will save over<br />
time. While irradiation does differ from<br />
region to region in the US, the amount of<br />
variation is remarkably small. According<br />
to solar radiation data from the National<br />
Renewable Energy Laboratory, Boston on<br />
average gets just 12 percent less sunlight<br />
than Miami. Data from select cities in the<br />
13 solar colonies is presented at page 32.<br />
Apart from sunlight, there are many<br />
system design factors that can influence<br />
Solar friendly States<br />
PV performance, such as system sizing,<br />
shading, tilt, and orientation. For exam-<br />
ple, has the installer picked the best roof<br />
on the house, or considered the fact there<br />
is a big tree in the middle of the southern<br />
skyline? Shading is one example of a fac-<br />
tor that can make your neighbor’s return<br />
on investment better than yours. These<br />
topics are beyond the scope of this article,<br />
however, but future issues of <strong>PHOTON</strong><br />
will investigate them in depth. For now,<br />
it’s important for the prospective PV buyer<br />
to know that the installer has can control<br />
many of these issues – you have to ask the<br />
installer the right questions.<br />
Solar incentives: all shapes and sizes<br />
A homeowner interested in purchasing<br />
a PV system can benefit from financial in-<br />
centives designed to improve the econom-<br />
ics of going solar. In the US, solar incen-<br />
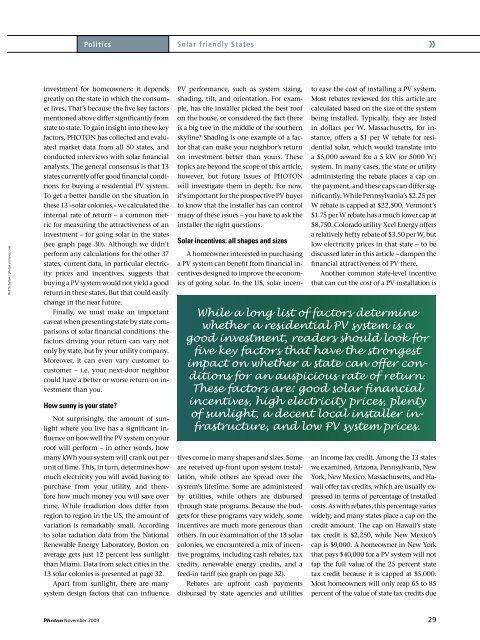
While a long list of factors determine<br />
whether a residential PV system is a<br />
good investment, readers should look for<br />
five key factors that have the strongest<br />
impact on whether a state can offer conditions<br />
for an auspicious rate of return.<br />
These factors are: good solar financial<br />
incentives, high electricity prices, plenty<br />
of sunlight, a decent local installer infrastructure,<br />
and low PV system prices.<br />
tives come in many shapes and sizes. Some<br />
are received up-front upon system instal-<br />
lation, while others are spread over the<br />
system’s lifetime. Some are administered<br />
by utilities, while others are disbursed<br />
through state programs. Because the bud-<br />
gets for these programs vary widely, some<br />
incentives are much more generous than<br />
others. In our examination of the 13 solar<br />
colonies, we encountered a mix of incen-<br />
tive programs, including cash rebates, tax<br />
credits, renewable energy credits, and a<br />
feed-in tariff (see graph on page 32).<br />
Rebates are upfront cash payments<br />
disbursed by state agencies and utilities<br />
November 2009 29<br />
»<br />
to ease the cost of installing a PV system.<br />
Most rebates reviewed for this article are<br />
calculated based on the size of the system<br />
being installed. Typically, they are listed<br />
in dollars per W. Massachusetts, for in-<br />
stance, offers a $1 per W rebate for resi-<br />
dential solar, which would translate into<br />
a $5,000 reward for a 5 kW (or 5000 W)<br />
system. In many cases, the state or utility<br />
administering the rebate places a cap on<br />
the payment, and these caps can differ sig-<br />
nificantly. While Pennsylvania’s $2.25 per<br />
W rebate is capped at $22,500, Vermont’s<br />
$1.75 per W rebate has a much lower cap at<br />
$8,750. Colorado utility Xcel Energy offers<br />
a relatively hefty rebate of $3.50 per W, but<br />
low electricity prices in that state – to be<br />
discussed later in this article – dampen the<br />
financial attractiveness of PV there.<br />
Another common state-level incentive<br />
that can cut the cost of a PV installation is<br />
an income tax credit. Among the 13 states<br />
we examined, Arizona, Pennsylvania, New<br />
York, New Mexico, Massachusetts, and Ha-<br />
waii offer tax credits, which are usually ex-<br />
pressed in terms of percentage of installed<br />
costs. As with rebates, this percentage varies<br />
widely, and many states place a cap on the<br />
credit amount. The cap on Hawaii’s state<br />
tax credit is $2,250, while New Mexico’s<br />
cap is $9,000. A homeowner in New York<br />
that pays $40,000 for a PV system will not<br />
tap the full value of the 25 percent state<br />
tax credit because it is capped at $5,000.<br />
Most homeowners will only reap 65 to 85<br />
percent of the value of state tax credits due