Meeting everyday needs of people everywhere - Unilever
Meeting everyday needs of people everywhere - Unilever
Meeting everyday needs of people everywhere - Unilever

You also want an ePaper? Increase the reach of your titles
YUMPU automatically turns print PDFs into web optimized ePapers that Google loves.
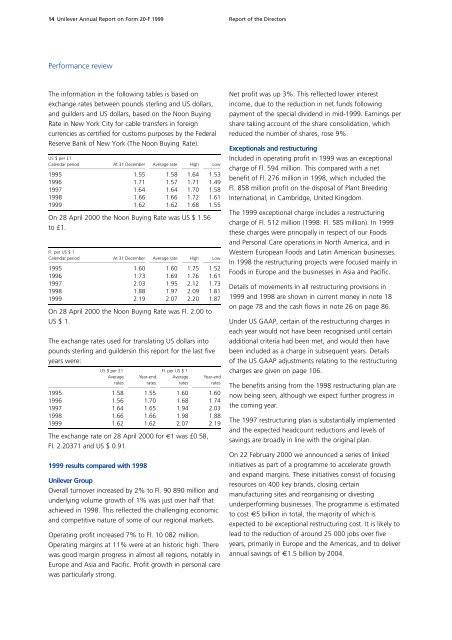
14 <strong>Unilever</strong> Annual Report on Form 20-F 1999 Report <strong>of</strong> the Directors<br />
Performance review<br />
The information in the following tables is based on<br />
exchange rates between pounds sterling and US dollars,<br />
and guilders and US dollars, based on the Noon Buying<br />
Rate in New York City for cable transfers in foreign<br />
c u r rencies as certified for customs purposes by the Federal<br />
Reserve Bank <strong>of</strong> New York (The Noon Buying Rate).<br />
US $ per £1<br />
Calendar period At 31 December Average rate High Low<br />
00005 0111 5111 5111<br />
1995 1.55 1.58 1.64 1.53<br />
1996 1.71 1.57 1.71 1.49<br />
1997 1.64 1.64 1.70 1.58<br />
1998 1.66 1.66 1.72 1.61<br />
1999 1.62 1.62 1.68 1.55<br />
On 28 April 2000 the Noon Buying Rate was US $ 1.56<br />
to £1.<br />
Fl. per US $ 1<br />
Calendar period At 31 December Average rate High Low<br />
00005 0111 5111 5111<br />
1995 1.60 1.60 1.75 1.52<br />
1996 1.73 1.69 1.76 1.61<br />
1997 2.03 1.95 2.12 1.73<br />
1998 1.88 1.97 2.09 1.81<br />
1999 2.19 2.07 2.20 1.87<br />
On 28 April 2000 the Noon Buying Rate was Fl. 2.00 to<br />
US $ 1.<br />
The exchange rates used for translating US dollars into<br />
pounds sterling and guildersin this report for the last five<br />
years were:<br />
US $ per £1 Fl. per US $ 1<br />
Average Year-end Average Year-end<br />
rates rates rates rates<br />
0050 0111 0111 0111<br />
1995 1.58 1.55 1.60 1.60<br />
1996 1.56 1.70 1.68 1.74<br />
1997 1.64 1.65 1.94 2.03<br />
1998 1.66 1.66 1.98 1.88<br />
1999 1.62 1.62 2.07 2.19<br />
The exchange rate on 28 April 2000 for €1 was £0.58,<br />
Fl. 2.20371 and US $ 0 . 9 1 .<br />
1999 results compared with 1998<br />
<strong>Unilever</strong> Group<br />
Overall turnover increased by 2% to Fl. 90 890 million and<br />
underlying volume growth <strong>of</strong> 1% was just over half that<br />
achieved in 1998. This reflected the challenging economic<br />
and competitive nature <strong>of</strong> some <strong>of</strong> our regional markets.<br />
Operating pr<strong>of</strong>it incre a s e d 7% to Fl. 10 082 million.<br />
Operating margins at 11% were at an historic high. There<br />
was good margin progress in almost all regions, notably in<br />
Europe and Asia and Pacific. Pr<strong>of</strong>it growth in personal care<br />
was particularly strong.<br />
Net pr<strong>of</strong>it was up 3%. This reflected lower interest<br />
income, due to the reduction in net funds following<br />
payment <strong>of</strong> the special dividend in mid-1999. Earnings per<br />
share taking account <strong>of</strong> the share consolidation, which<br />
reduced the number <strong>of</strong> shares, rose 9%.<br />
Exceptionals and restructuring<br />
Included in operating pr<strong>of</strong>it in 1999 was an exceptional<br />
charge <strong>of</strong> Fl. 594 million. This compared with a net<br />
benefit <strong>of</strong> Fl. 276 million in 1998, which included the<br />
Fl. 858 million pr<strong>of</strong>it on the disposal <strong>of</strong> Plant Breeding<br />
International, in Cambridge, United Kingdom.<br />
The 1999 exceptional charge includes a restructuring<br />
charge <strong>of</strong> Fl. 512 million (1998: Fl. 585 million). In 1999<br />
these charges were principally in respect <strong>of</strong> our Foods<br />
and Personal Care operations in North America, and in<br />
Western European Foods and Latin American businesses.<br />
In 1998 the restructuring projects were focused mainly in<br />
Foods in Europe and the businesses in Asia and Pacific.<br />
Details <strong>of</strong> movements in all restructuring provisions in<br />
1999 and 1998 are shown in current money in note 18<br />
on page 78 and the cash flows in note 26 on page 86.<br />
Under US GAAP, certain <strong>of</strong> the restructuring charges in<br />
each year would not have been recognised until certain<br />
additional criteria had been met, and would then have<br />
been included as a charge in subsequent years. Details<br />
<strong>of</strong> the US GAAP adjustments relating to the restructuring<br />
charges are given on page 106.<br />
The benefits arising from the 1998 restructuring plan are<br />
now being seen, although we expect further progress in<br />
the coming year.<br />
The 1997 restructuring plan is substantially implemented<br />
and the expected headcount reductions and levels <strong>of</strong><br />
savings are broadly in line with the original plan.<br />
On 22 February 2000 we announced a series <strong>of</strong> linked<br />
initiatives as part <strong>of</strong> a programme to accelerate growth<br />
and expand margins. These initiatives consist <strong>of</strong> focusing<br />
resources on 400 key brands, closing certain<br />
manufacturing sites and reorganising or divesting<br />
underperforming businesses. The programme is estimated<br />
to cost €5 billion in total, the majority <strong>of</strong> which is<br />
expected to be exceptional restructuring cost. It is likely to<br />
lead to the reduction <strong>of</strong> around 25 000 jobs over five<br />
years, primarily in Europe and the Americas, and to deliver<br />
annual savings <strong>of</strong> €1.5 billion by 2004.