Illiquid assets
Unwrapping alternative returns Global Investor, 01/2015 Credit Suisse
Unwrapping alternative returns
Global Investor, 01/2015
Credit Suisse

You also want an ePaper? Increase the reach of your titles
YUMPU automatically turns print PDFs into web optimized ePapers that Google loves.
GLOBAL INVESTOR 1.15 — 17<br />
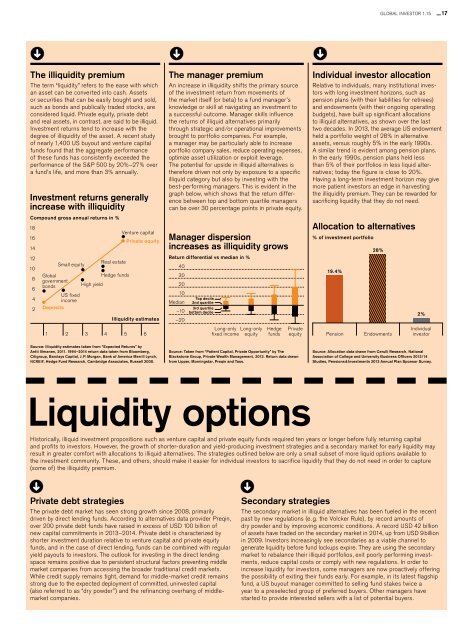
The illiquidity premium<br />
The term “liquidity” refers to the ease with which<br />
an asset can be converted into cash. Assets<br />
or securities that can be easily bought and sold,<br />
such as bonds and publically traded stocks, are<br />
considered liquid. Private equity, private debt<br />
and real <strong>assets</strong>, in contrast, are said to be illiquid.<br />
Investment returns tend to increase with the<br />
degree of illiquidity of the asset. A recent study<br />
of nearly 1,400 US buyout and venture capital<br />
funds found that the aggregate performance<br />
of these funds has consistently exceeded the<br />
performance of the S&P 500 by 20%–27% over<br />
a fund’s life, and more than 3% annually.<br />
Investment returns generally<br />
increase with illiquidity<br />
Compound gross annual returns in %<br />
18<br />
16<br />
14<br />
12<br />
10<br />
8<br />
6<br />
4<br />
2<br />
Global<br />
government<br />
bonds<br />
Small equity<br />
US fixed<br />
income<br />
Deposits<br />
High yield<br />
Real estate<br />
Hedge funds<br />
1 2 3 4 5<br />
Venture capital<br />
Private equity<br />
<strong>Illiquid</strong>ity estimates<br />
6<br />
The manager premium<br />
An increase in illiquidity shifts the primary source<br />
of the investment return from movements of<br />
the market itself (or beta) to a fund manager’s<br />
knowledge or skill at navigating an investment to<br />
a successful outcome. Manager skills influence<br />
the returns of illiquid alternatives primarily<br />
through strategic and/or operational improvements<br />
brought to portfolio companies. For example,<br />
a manager may be particularly able to increase<br />
portfolio company sales, reduce operating expenses,<br />
optimize asset utilization or exploit leverage.<br />
The potential for upside in illiquid alternatives is<br />
therefore driven not only by exposure to a specific<br />
illiquid category but also by investing with the<br />
best-performing managers. This is evident in the<br />
graph below, which shows that the return difference<br />
between top and bottom quartile managers<br />
can be over 30 percentage points in private equity.<br />
Manager dispersion<br />
increases as illiquidity grows<br />
Return differential vs median in %<br />
40<br />
30<br />
20<br />
10<br />
Top decile<br />
Median 2nd quartile<br />
3rd quartile<br />
–10 bottom decile<br />
–20<br />
Long-only Long-only<br />
fixed income equity<br />
Hedge<br />
funds<br />
Private<br />
equity<br />
Individual investor allocation<br />
Relative to individuals, many institutional investors<br />
with long investment horizons, such as<br />
pension plans (with their liabilities for retirees)<br />
and endowments (with their ongoing operating<br />
budgets), have built up significant allocations<br />
to illiquid alternatives, as shown over the last<br />
two decades. In 2013, the average US endowment<br />
held a portfolio weight of 28% in alternative<br />
<strong>assets</strong>, versus roughly 5% in the early 1990s.<br />
A similar trend is evident among pension plans.<br />
In the early 1990s, pension plans held less<br />
than 5% of their portfolios in less liquid alternatives;<br />
today the figure is close to 20%.<br />
Having a long-term investment horizon may give<br />
more patient investors an edge in harvesting<br />
the illiquidity premium. They can be rewarded for<br />
sacrificing liquidity that they do not need.<br />
Allocation to alternatives<br />
% of investment portfolio<br />
19.4%<br />
Pension<br />
28%<br />
Endowments<br />
2%<br />
Individual<br />
investor<br />
Source: <strong>Illiquid</strong>ity estimates taken from “Expected Returns” by<br />
Antti Illmanen, 2011. 1994–2014 return data taken from Bloomberg,<br />
Citigroup, Barclays Capital, J. P. Morgan, Bank of America Merrill Lynch,<br />
NCREIF, Hedge Fund Research, Cambridge Associates, Russell 2000.<br />
Source: Taken from “Patient Capital, Private Opportunity” by The<br />
Blackstone Group, Private Wealth Management, 2013. Return data drawn<br />
from Lipper, Morningstar, Preqin and Tass.<br />
Source: Allocation data drawn from Cerulli Research, National<br />
Association of College and University Business Officers 2013/14<br />
Studies, Pensions & Investments 2013 Annual Plan Sponsor Survey.<br />
Liquidity options<br />
Historically, illiquid investment propositions such as venture capital and private equity funds required ten years or longer before fully returning capital<br />
and profits to investors. However, the growth of shorter-duration and yield-producing investment strategies and a secondary market for early liquidity may<br />
result in greater comfort with allocations to illiquid alternatives. The strategies outlined below are only a small subset of more liquid options available to<br />
the investment community. These, and others, should make it easier for individual investors to sacrifice liquidity that they do not need in order to capture<br />
(some of) the illiquidity premium.<br />
Private debt strategies<br />
The private debt market has seen strong growth since 2008, primarily<br />
driven by direct lending funds. According to alternatives data provider Preqin,<br />
over 200 private debt funds have raised in excess of USD 100 billion of<br />
new capital commitments in 2013–2014. Private debt is characterized by<br />
shorter investment duration relative to venture capital and private equity<br />
funds, and in the case of direct lending, funds can be combined with regular<br />
yield payouts to investors. The outlook for investing in the direct lending<br />
space remains positive due to persistent structural factors preventing middle<br />
market companies from accessing the broader traditional credit markets.<br />
While credit supply remains tight, demand for middle-market credit remains<br />
strong due to the expected deployment of committed, uninvested capital<br />
(also referred to as “dry powder”) and the refinancing overhang of middlemarket<br />
companies.<br />
Secondary strategies<br />
The secondary market in illiquid alternatives has been fueled in the recent<br />
past by new regulations (e. g. the Volcker Rule), by record amounts of<br />
dry powder and by improving economic conditions. A record USD 42 billion<br />
of <strong>assets</strong> have traded on the secondary market in 2014, up from USD 9 billion<br />
in 2009. Investors increasingly see secondaries as a viable channel to<br />
generate liquidity before fund lockups expire. They are using the secondary<br />
market to rebalance their illiquid portfolios, exit poorly performing investments,<br />
reduce capital costs or comply with new regulations. In order to<br />
increase liquidity for investors, some managers are now proactively offering<br />
the possibility of exiting their funds early. For example, in its latest flagship<br />
fund, a US buyout manager committed to selling fund stakes twice a<br />
year to a preselected group of preferred buyers. Other managers have<br />
started to provide interested sellers with a list of potential buyers.