

Druck-Materie 20b.qxd - JUWEL - Forschungszentrum Jülich
Druck-Materie 20b.qxd - JUWEL - Forschungszentrum Jülich
Druck-Materie 20b.qxd - JUWEL - Forschungszentrum Jülich

You also want an ePaper? Increase the reach of your titles
YUMPU automatically turns print PDFs into web optimized ePapers that Google loves.
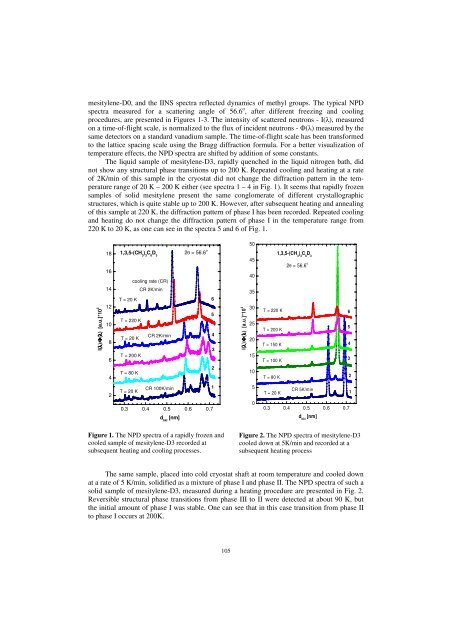
mesitylene-D0, and the IINS spectra reflected dynamics of methyl groups. The typical NPD<br />
spectra measured for a scattering angle of 56.6 o , after different freezing and cooling<br />
procedures, are presented in Figures 1-3. The intensity of scattered neutrons - I(λ), measured<br />
on a time-of-flight scale, is normalized to the flux of incident neutrons - Φ(λ) measured by the<br />
same detectors on a standard vanadium sample. The time-of-flight scale has been transformed<br />
to the lattice spacing scale using the Bragg diffraction formula. For a better visualization of<br />
temperature effects, the NPD spectra are shifted by addition of some constants.<br />
The liquid sample of mesitylene-D3, rapidly quenched in the liquid nitrogen bath, did<br />
not show any structural phase transitions up to 200 K. Repeated cooling and heating at a rate<br />
of 2K/min of this sample in the cryostat did not change the diffraction pattern in the temperature<br />
range of 20 K – 200 K either (see spectra 1 – 4 in Fig. 1). It seems that rapidly frozen<br />
samples of solid mesitylene present the same conglomerate of different crystallographic<br />
structures, which is quite stable up to 200 K. However, after subsequent heating and annealing<br />
of this sample at 220 K, the diffraction pattern of phase I has been recorded. Repeated cooling<br />
and heating do not change the diffraction pattern of phase I in the temperature range from<br />
220 K to 20 K, as one can see in the spectra 5 and 6 of Fig. 1.<br />
I(λ)/Φ(λ) [a.u.]*10 3<br />
18<br />
16<br />
14<br />
12<br />
10<br />
8<br />
6<br />
4<br />
2<br />
1,3,5-(CH 3 ) 3 C 6 D 3<br />
T = 20 K<br />
T = 220 K<br />
T = 20 K<br />
T = 200 K<br />
T = 80 K<br />
T = 20 K<br />
cooling rate (CR)<br />
CR 2K/min<br />
CR 2K/min<br />
CR 100K/min<br />
0.3 0.4 0.5 0.6 0.7<br />
d hkl [nm]<br />
2θ = 56.6 o<br />
Figure 1. The NPD spectra of a rapidly frozen and<br />
cooled sample of mesitylene-D3 recorded at<br />
subsequent heating and cooling processes.<br />
6<br />
5<br />
4<br />
3<br />
2<br />
1<br />
105<br />
I(λ)/ΦΦ(λ) [a.u.]*10 3<br />
50<br />
45<br />
40<br />
35<br />
30<br />
25<br />
20<br />
15<br />
10<br />
5<br />
0<br />
T = 220 K<br />
T = 200 K<br />
T = 150 K<br />
T = 100 K<br />
T = 80 K<br />
T = 20 K<br />
1,3,5-(CH 3 ) 3 C 6 D 3<br />
2θ = 56.6 o<br />
CR 5K/min<br />
0.3 0.4 0.5 0.6 0.7<br />
d hkl [nm]<br />
Figure 2. The NPD spectra of mesitylene-D3<br />
cooled down at 5K/min and recorded at a<br />
subsequent heating process<br />
The same sample, placed into cold cryostat shaft at room temperature and cooled down<br />
at a rate of 5 K/min, solidified as a mixture of phase I and phase II. The NPD spectra of such a<br />
solid sample of mesitylene-D3, measured during a heating procedure are presented in Fig. 2.<br />
Reversible structural phase transitions from phase III to II were detected at about 90 K, but<br />
the initial amount of phase I was stable. One can see that in this case transition from phase II<br />
to phase I occurs at 200K.<br />
6<br />
5<br />
4<br />
3<br />
2<br />
1


