- Page 1 and 2:
ACoM - 6 6th 6 International Worksh
- Page 3 and 4:
Forschungszentrum Jülich GmbH Inst
- Page 5:
Preface These are the Proceedings o
- Page 8 and 9:
List of participants, cont’d. Kü
- Page 10 and 11:
Pepe M. 43 Petriw S. 43 Picton D.J.
- Page 12 and 13:
Experimental background, results an
- Page 14 and 15:
• Light water ice as H(H2O) at T
- Page 16 and 17:
In Table 2 a survey is given about
- Page 18 and 19:
sigma-T in barns/molecule Figure 4.
- Page 20 and 21:
2.3 Liquid water Compared to the so
- Page 22 and 23:
presented. The corresponding experi
- Page 24 and 25:
3.2 Gaseous hydrogen and deuterium
- Page 26 and 27:
Rho(Omega) normalised 160 140 120 1
- Page 28 and 29:
elatively free and can also suffer
- Page 30 and 31:
Figure 16. Heat Capacity for Solid
- Page 32 and 33:
o-D2 and p-H2 at 5K for an ucn ener
- Page 34 and 35:
Figure 22. UCN Upscattering Rates i
- Page 36 and 37:
ho(omega) normalised 40 35 30 25 20
- Page 38 and 39:
derived from Walker [52]. The neutr
- Page 40 and 41:
Since there is only a small gain of
- Page 42 and 43:
7. CALCULATION OF SCATTERING LAW DA
- Page 44 and 45:
For the validation of these data se
- Page 46 and 47:
[36] Nielsen, M.: Phonons in Solid
- Page 48 and 49:
2. THE CASE OF MOLECULAR SOLIDS An
- Page 50 and 51:
γ r ( 0) ≅ 2 2 2 T erf e ( ) / 2
- Page 52 and 53:
4. PRELIMINARY APPLICATION Solid Me
- Page 54 and 55:
[5] Meeting on Moderator Concepts a
- Page 56 and 57:
state. Conversely, the monatomic hy
- Page 58 and 59:
Note that the equilibrium trihydrog
- Page 60 and 61:
para hydrogen system under irradiat
- Page 62 and 63:
[12] T. E. Fessler and J. W. Blue,
- Page 64 and 65:
tion of neutron intensities, partic
- Page 66 and 67:
varied between calculations but the
- Page 68 and 69:
5. THE OPTIMISATION OF MULTIPLY GRO
- Page 70 and 71:
Figure 7. A comparison of time dist
- Page 72 and 73:
4.8 cm hydrogen slab in front of a
- Page 75 and 76:
ACoM - 6 6 th Meeting of the Collab
- Page 77 and 78:
the moderator is annealed every 12
- Page 79 and 80:
The method requires two additional
- Page 81 and 82:
ABSTRACT ACoM - 6 6 th Meeting of t
- Page 83 and 84:
Heat transfer processes across phas
- Page 85 and 86:
3. TWO-PHASE FLOW PATTERN IN THE MO
- Page 87 and 88:
continuous phase dominating, and a
- Page 89 and 90:
Also the velocity pattern has chang
- Page 91 and 92:
Figure 8. Methane pellets concentra
- Page 93 and 94:
ACoM - 6 6 th Meeting of the Collab
- Page 95 and 96:
sample volume and the nominal densi
- Page 97 and 98:
The results presented in this paper
- Page 99:
Table 10. Summary of energy transfe
- Page 102 and 103:
2. EXPERIMENTAL Methane hydrate was
- Page 104 and 105:
Figure 4. Energy levels of methane
- Page 106 and 107:
102
- Page 108 and 109:
phase transitions from phase II to
- Page 110 and 111:
After melting phase I in the cryost
- Page 112 and 113:
4. SOLID PHASES OF MESITYLENE-D0 AN
- Page 114 and 115:
G(ν) [a.u.] 8 6 4 2 Phase II Phase
- Page 116 and 117:
112
- Page 118 and 119:
A not quite as perfect cold spectru
- Page 120 and 121:
2.2 Inelastic neutron scattering Th
- Page 122 and 123:
Figure 4. Inelastic spectra at the
- Page 124 and 125:
3.2 Moderator performance The resul
- Page 126 and 127:
122
- Page 128 and 129:
Figure 2. The methane pelletizer, m
- Page 130 and 131: Figure 5. The cryogenic hopper fill
- Page 132 and 133: 128
- Page 134 and 135: ture
- Page 136 and 137: The charging device scheme could be
- Page 138 and 139: Table 1. Data of irradiation of met
- Page 140 and 141: 5. METHODS OF PROCESSING OF RAW EXP
- Page 142 and 143: of radicals, that is, before a burp
- Page 144 and 145: 6.2 Condition for thermally stimula
- Page 146 and 147: Table 4. Estimated values of an ene
- Page 148 and 149: • Nine spontaneous burps were obs
- Page 150 and 151: APPENDIX Some useful relations and
- Page 152 and 153: APPENDIX. Graphs of burps. 148
- Page 154 and 155: 150
- Page 156 and 157: 152
- Page 158 and 159: 154
- Page 160 and 161: 2. EXPERIMENTAL SETUP Fig. 1 will g
- Page 162 and 163: All these parameters are kept const
- Page 164 and 165: 4. CONCLUSIONS We demonstrated that
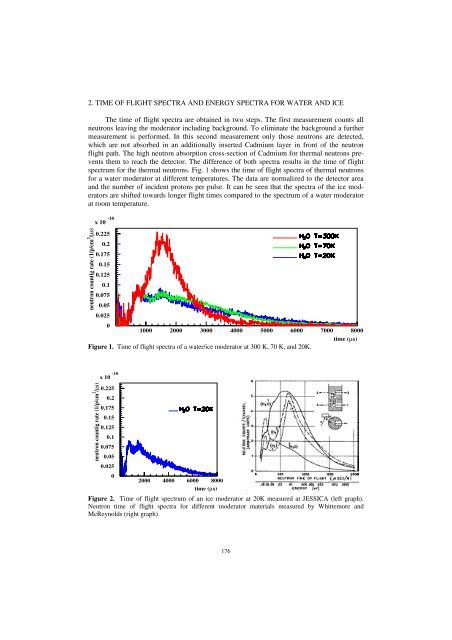
- Page 166 and 167: JESSICA (Juelich Experimental Spall
- Page 168 and 169: The moderator system consists of th
- Page 170 and 171: to change the temperatures and to p
- Page 172 and 173: 168
- Page 174 and 175: supplied from the high pressure bom
- Page 176 and 177: 10 9 10 8 10 7 10 6 Para35%[Experim
- Page 178 and 179: 174
- Page 182 and 183: When applying this transformation t
- Page 184 and 185: data were analyzed in more detail.
- Page 186 and 187: 182
- Page 188 and 189: First of all, we should conclude th
- Page 190 and 191: The equation (a) may also describe
- Page 192 and 193: Even at h=0.01 mm which is too smal
- Page 194 and 195: model and some consequences of its
- Page 196 and 197: methane and 0.7-1.5% for water ice
- Page 198 and 199: case: the sample of infinite size.
- Page 200 and 201: 196
- Page 202 and 203: 198
- Page 204 and 205: 200
- Page 206 and 207: 202
- Page 208 and 209: 204
- Page 210 and 211: 206
- Page 212 and 213: 208
- Page 214 and 215: 210
- Page 216 and 217: Phase Diagram of the CH4-H20 system
- Page 218 and 219: Reaction Chamber for Hydrate Produc
- Page 220 and 221: Analysis: X-ray diffraction pattern
- Page 222 and 223: Comparison with non-hydrate forming
- Page 224 and 225: Mechanical Tests: Apparatus 220
- Page 226 and 227: Morphology of Indium Jacket 222
- Page 228 and 229: Schriften des Forschungszentrums J
- Page 230 and 231:
Schriften des Forschungszentrums J


