

Druck-Materie 20b.qxd - JUWEL - Forschungszentrum Jülich
Druck-Materie 20b.qxd - JUWEL - Forschungszentrum Jülich
Druck-Materie 20b.qxd - JUWEL - Forschungszentrum Jülich

You also want an ePaper? Increase the reach of your titles
YUMPU automatically turns print PDFs into web optimized ePapers that Google loves.
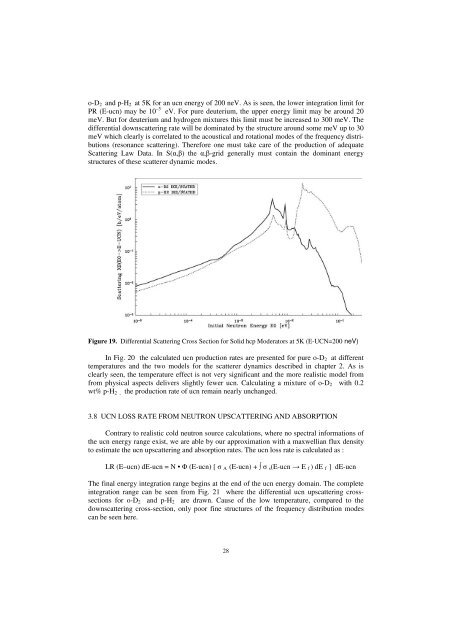
o-D2 and p-H2 at 5K for an ucn energy of 200 neV. As is seen, the lower integration limit for<br />
PR (E-ucn) may be 10 –5 eV. For pure deuterium, the upper energy limit may be around 20<br />
meV. But for deuterium and hydrogen mixtures this limit must be increased to 300 meV. The<br />
differential downscattering rate will be dominated by the structure around some meV up to 30<br />
meV which clearly is correlated to the acoustical and rotational modes of the frequency distributions<br />
(resonance scattering). Therefore one must take care of the production of adequate<br />
Scattering Law Data. In S(α,β) the α,β-grid generally must contain the dominant energy<br />
structures of these scatterer dynamic modes.<br />
Figure 19. Differential Scattering Cross Section for Solid hcp Moderators at 5K (E-UCN=200 neV)<br />
In Fig. 20 the calculated ucn production rates are presented for pure o-D2 at different<br />
temperatures and the two models for the scatterer dynamics described in chapter 2. As is<br />
clearly seen, the temperature effect is not very significant and the more realistic model from<br />
from physical aspects delivers slightly fewer ucn. Calculating a mixture of o-D2 with 0.2<br />
wt% p-H2 , the production rate of ucn remain nearly unchanged.<br />
3.8 UCN LOSS RATE FROM NEUTRON UPSCATTERING AND ABSORPTION<br />
Contrary to realistic cold neutron source calculations, where no spectral informations of<br />
the ucn energy range exist, we are able by our approximation with a maxwellian flux density<br />
to estimate the ucn upscattering and absorption rates. The ucn loss rate is calculated as :<br />
LR (E–ucn) dE-ucn = N • Φ (E-ucn) [ σ A (E-ucn) + ∫ σ s(E-ucn → E f ) dE f ] dE-ucn<br />
The final energy integration range begins at the end of the ucn energy domain. The complete<br />
integration range can be seen from Fig. 21 where the differential ucn upscattering crosssections<br />
for o-D2 and p-H2 are drawn. Cause of the low temperature, compared to the<br />
downscattering cross-section, only poor fine structures of the frequency distribution modes<br />
can be seen here.<br />
28


