

Druck-Materie 20b.qxd - JUWEL - Forschungszentrum Jülich
Druck-Materie 20b.qxd - JUWEL - Forschungszentrum Jülich
Druck-Materie 20b.qxd - JUWEL - Forschungszentrum Jülich

You also want an ePaper? Increase the reach of your titles
YUMPU automatically turns print PDFs into web optimized ePapers that Google loves.
Step 1: Normal gas is filled in both Pirani gauges and the bridge circuit was adjusted so as<br />
to diminish the electromotive force.�<br />
Step 2: Normal gas in one of the Pirani gauges is exchanged by sample gas.�<br />
Step 3: V is measured.<br />
The voltage measurement was performed at a hydrogen pressure of 5.3x10³ Pa. We have to<br />
make calibration curve of voltage vs. para-ratio before hand. The accuracy of this measurement<br />
is not clear now but it may be less than 2-3%. We intended to check the accuracy by<br />
using Raman spectroscopy.<br />
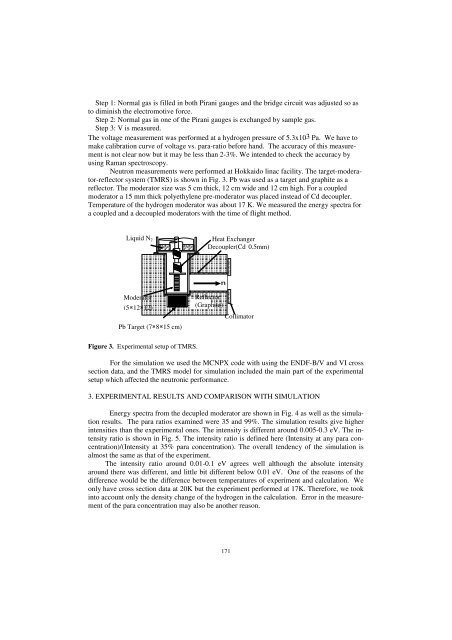
Neutron measurements were performed at Hokkaido linac facility. The target-moderator-reflector<br />
system (TMRS) is shown in Fig. 3. Pb was used as a target and graphite as a<br />
reflector. The moderator size was 5 cm thick, 12 cm wide and 12 cm high. For a coupled<br />
moderator a 15 mm thick polyethylene pre-moderator was placed instead of Cd decoupler.<br />
Temperature of the hydrogen moderator was about 17 K. We measured the energy spectra for<br />
a coupled and a decoupled moderators with the time of flight method.<br />
Liquid N2<br />
Moderator<br />
(5 � 12 � 12)<br />
Pb Target (7 � 8 � 15 cm)<br />
Figure 3. Experimental setup of TMRS.<br />
Heat Exchanger<br />
Decoupler(Cd 0.5mm)<br />
For the simulation we used the MCNPX code with using the ENDF-B/V and VI cross<br />
section data, and the TMRS model for simulation included the main part of the experimental<br />
setup which affected the neutronic performance.<br />
3. EXPERIMENTAL RESULTS AND COMPARISON WITH SIMULATION<br />
n<br />
Reflector<br />
(Graphite)<br />
Collimator<br />
Energy spectra from the decupled moderator are shown in Fig. 4 as well as the simulation<br />
results. The para ratios examined were 35 and 99%. The simulation results give higher<br />
intensities than the experimental ones. The intensity is different around 0.005-0.3 eV. The intensity<br />
ratio is shown in Fig. 5. The intensity ratio is defined here (Intensity at any para concentration)/(Intensity<br />
at 35% para concentration). The overall tendency of the simulation is<br />
almost the same as that of the experiment.<br />
The intensity ratio around 0.01-0.1 eV agrees well although the absolute intensity<br />
around there was different, and little bit different below 0.01 eV. One of the reasons of the<br />
difference would be the difference between temperatures of experiment and calculation. We<br />
only have cross section data at 20K but the experiment performed at 17K. Therefore, we took<br />
into account only the density change of the hydrogen in the calculation. Error in the measurement<br />
of the para concentration may also be another reason.<br />
171


