

Druck-Materie 20b.qxd - JUWEL - Forschungszentrum Jülich
Druck-Materie 20b.qxd - JUWEL - Forschungszentrum Jülich
Druck-Materie 20b.qxd - JUWEL - Forschungszentrum Jülich

Create successful ePaper yourself
Turn your PDF publications into a flip-book with our unique Google optimized e-Paper software.
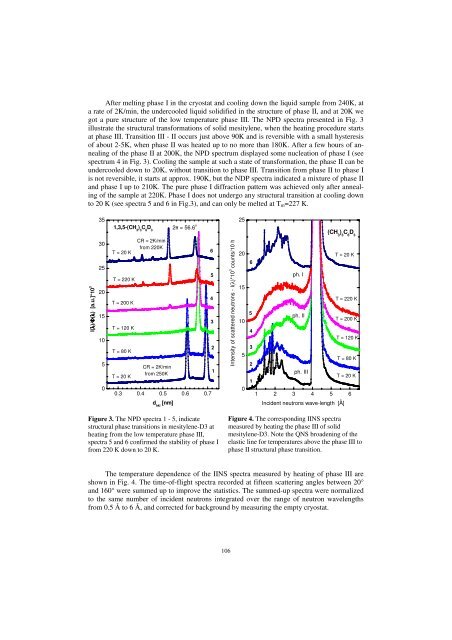
After melting phase I in the cryostat and cooling down the liquid sample from 240K, at<br />
a rate of 2K/min, the undercooled liquid solidified in the structure of phase II, and at 20K we<br />
got a pure structure of the low temperature phase III. The NPD spectra presented in Fig. 3<br />
illustrate the structural transformations of solid mesitylene, when the heating procedure starts<br />
at phase III. Transition III - II occurs just above 90K and is reversible with a small hysteresis<br />
of about 2-5K, when phase II was heated up to no more than 180K. After a few hours of annealing<br />
of the phase II at 200K, the NPD spectrum displayed some nucleation of phase I (see<br />
spectrum 4 in Fig. 3). Cooling the sample at such a state of transformation, the phase II can be<br />
undercooled down to 20K, without transition to phase III. Transition from phase II to phase I<br />
is not reversible, it starts at approx. 190K, but the NDP spectra indicated a mixture of phase II<br />
and phase I up to 210K. The pure phase I diffraction pattern was achieved only after annealing<br />
of the sample at 220K. Phase I does not undergo any structural transition at cooling down<br />
to 20 K (see spectra 5 and 6 in Fig.3), and can only be melted at Tm=227 K.<br />
I(λ)/ΦΦ(λλ) [a.u.]*10 3<br />
35<br />
30<br />
25<br />
20<br />
15<br />
10<br />
5<br />
0<br />
1,3,5-(CH 3 ) 3 C 6 D 3<br />
T = 20 K<br />
T = 220 K<br />
T = 200 K<br />
T = 120 K<br />
T = 80 K<br />
T = 20 K<br />
CR = 2K/min<br />
from 220K<br />
CR = 2K/min<br />
from 250K<br />
0.3 0.4 0.5 0.6 0.7<br />
d hkl [nm]<br />
2θ = 56.6 o<br />
Figure 3. The NPD spectra 1 - 5, indicate<br />
structural phase transitions in mesitylene-D3 at<br />
heating from the low temperature phase III,<br />
spectra 5 and 6 confirmed the stability of phase I<br />
from 220 K down to 20 K.<br />
6<br />
5<br />
4<br />
3<br />
2<br />
1<br />
Intensity of scattered neutrons - I(λ)*10 3 counts/10 h<br />
106<br />
25<br />
20<br />
15<br />
10<br />
5<br />
0<br />
6<br />
5<br />
4<br />
3<br />
2<br />
1<br />
ph. I<br />
ph. II<br />
ph. III<br />
(CH 3 ) 3 C 6 D 3<br />
T = 20 K<br />
T = 220 K<br />
T = 200 K<br />
T = 120 K<br />
T = 80 K<br />
T = 20 K<br />
1 2 3 4 5 6<br />
Incident neutrons wave-length [A]<br />
Figure 4. The corresponding IINS spectra<br />
measured by heating the phase III of solid<br />
mesitylene-D3. Note the QNS broadening of the<br />
elastic line for temperatures above the phase III to<br />
phase II structural phase transition.<br />
The temperature dependence of the IINS spectra measured by heating of phase III are<br />
shown in Fig. 4. The time-of-flight spectra recorded at fifteen scattering angles between 20°<br />
and 160° were summed up to improve the statistics. The summed-up spectra were normalized<br />
to the same number of incident neutrons integrated over the range of neutron wavelengths<br />
from 0.5 Å to 6 Å, and corrected for background by measuring the empty cryostat.<br />
o


