

Druck-Materie 20b.qxd - JUWEL - Forschungszentrum Jülich
Druck-Materie 20b.qxd - JUWEL - Forschungszentrum Jülich
Druck-Materie 20b.qxd - JUWEL - Forschungszentrum Jülich

Create successful ePaper yourself
Turn your PDF publications into a flip-book with our unique Google optimized e-Paper software.
All these parameters are kept constant during the experiment. The distribution of the n/p-ratio<br />
is also plotted in Fig 3. You can see that these ratio is nearly constant.<br />
3. RESULTS FROM WATER AND POLYETHYLENE<br />
We started our experiments with a water moderator at ambient temperature. The advantage<br />
of such a moderator is the well known spectra which is helpful to test a new experiment.<br />
The measurement of the thermal neutron time of flight spectrum was performed in to<br />
steps. The first measurement counts all neutrons leaving the moderator including background.<br />
To eliminate the background a further measurement is performed. In this second measurement<br />
only those neutrons are detected, which are not absorbed in an additionally inserted cadmium<br />
layer in front of the neutron flight path. The high neutron absorption cross section of cadmium<br />
for thermal neutrons prevents them to reach the detector. The difference of both spectra<br />
results in the time of flight spectra for the thermal neutrons. Thus these spectra are normalized<br />
to the number of incident protons they can directly compared with Monte-Carlo simulations.<br />
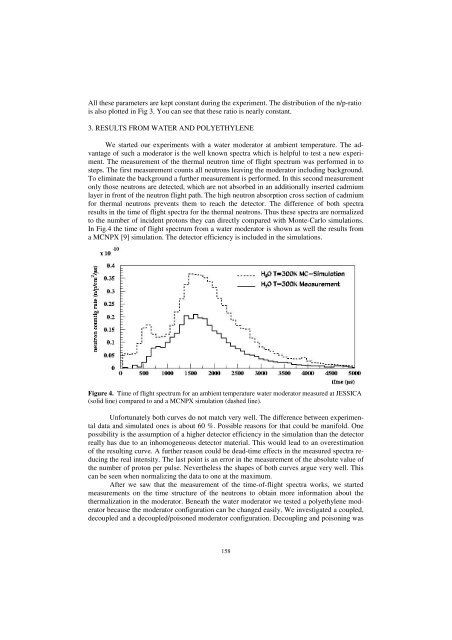
In Fig.4 the time of flight spectrum from a water moderator is shown as well the results from<br />
a MCNPX [9] simulation. The detector efficiency is included in the simulations.<br />
Figure 4. Time of flight spectrum for an ambient temperature water moderator measured at JESSICA<br />
(solid line) compared to and a MCNPX simulation (dashed line).<br />
Unfortunately both curves do not match very well. The difference between experimental<br />
data and simulated ones is about 60 %. Possible reasons for that could be manifold. One<br />
possibility is the assumption of a higher detector efficiency in the simulation than the detector<br />
really has due to an inhomogeneous detector material. This would lead to an overestimation<br />
of the resulting curve. A further reason could be dead-time effects in the measured spectra reducing<br />
the real intensity. The last point is an error in the measurement of the absolute value of<br />
the number of proton per pulse. Nevertheless the shapes of both curves argue very well. This<br />
can be seen when normalizing the data to one at the maximum.<br />
After we saw that the measurement of the time-of-flight spectra works, we started<br />
measurements on the time structure of the neutrons to obtain more information about the<br />
thermalization in the moderator. Beneath the water moderator we tested a polyethylene moderator<br />
because the moderator configuration can be changed easily. We investigated a coupled,<br />
decoupled and a decoupled/poisoned moderator configuration. Decoupling and poisoning was<br />
158


