

Druck-Materie 20b.qxd - JUWEL - Forschungszentrum Jülich
Druck-Materie 20b.qxd - JUWEL - Forschungszentrum Jülich
Druck-Materie 20b.qxd - JUWEL - Forschungszentrum Jülich

Create successful ePaper yourself
Turn your PDF publications into a flip-book with our unique Google optimized e-Paper software.
data were analyzed in more detail. We determined the peak width at FWHM and the decay<br />
constant. The values are listed in Tab.2.<br />
Table 2. Peak widths and decay constants for water at 300 K and ice at 20 K for different wavelengths.<br />
0.95 Å 1.19 Å 1.58 Å 2.37 Å 4.74 Å<br />
300 K<br />
Peak width at FWHM in µs 50 60 µs 90 µs 100 µs<br />
decay constant µs -1 20 K<br />
0.018±12% 0.016±6% 0.014±7.5% 0.015±10%<br />
Peak width at FWHM in µs 30 µs 50 µs 90 µs 280 µs<br />
decay constant µs -1 0.057±12% 0.039±12% 0.019±9% 0.005±8%<br />
4. ENERGY SPECTRA OF A METHANE-HYDRATE MODERATOR<br />
For the first time we investigated a methane-hydrate moderator. The basic idea of such a<br />
moderator is to combine the spectral properties of ice and solid methane resulting in higher<br />
neutron intensity over a broader energy region. This will help to increase the neutron current<br />
of a spallation neutron source by a factor of two to three. With the JESSICA experiment we<br />
like to validate this presumption.<br />
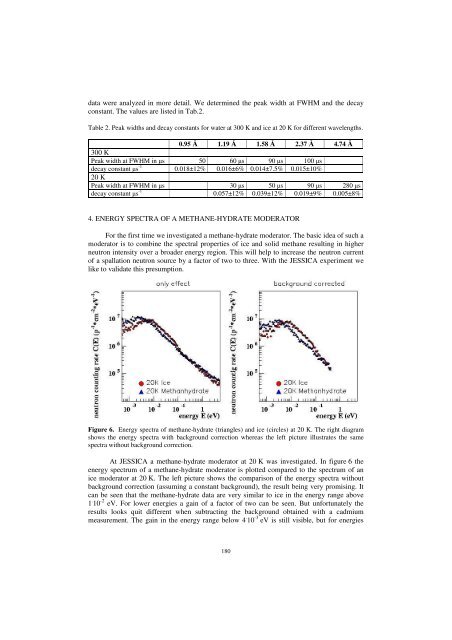
Figure 6. Energy spectra of methane-hydrate (triangles) and ice (circles) at 20 K. The right diagram<br />
shows the energy spectra with background correction whereas the left picture illustrates the same<br />
spectra without background correction.<br />
At JESSICA a methane-hydrate moderator at 20 K was investigated. In figure 6 the<br />
energy spectrum of a methane-hydrate moderator is plotted compared to the spectrum of an<br />
ice moderator at 20 K. The left picture shows the comparison of the energy spectra without<br />
background correction (assuming a constant background), the result being very promising. It<br />
can be seen that the methane-hydrate data are very similar to ice in the energy range above<br />
1 . 10 -2 eV. For lower energies a gain of a factor of two can be seen. But unfortunately the<br />
results looks quit different when subtracting the background obtained with a cadmium<br />
measurement. The gain in the energy range below 4 . 10 -3 eV is still visible, but for energies<br />
180


