

Hidden Unemployment
Hidden Unemployment
Hidden Unemployment

Create successful ePaper yourself
Turn your PDF publications into a flip-book with our unique Google optimized e-Paper software.
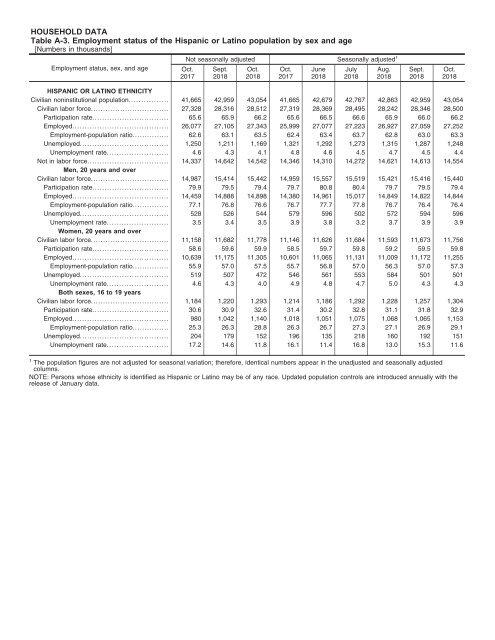
HOUSEHOLD DATA<br />
Table A-3. Employment status of the Hispanic or Latino population by sex and age<br />
[Numbers in thousands]<br />
Employment status, sex, and age<br />
Not seasonally adjusted Seasonally adjusted 1<br />
Oct.<br />
2017<br />
Sept.<br />
2018<br />
Oct.<br />
2018<br />
Oct.<br />
2017<br />
June<br />
2018<br />
July<br />
2018<br />
Aug.<br />
2018<br />
Sept.<br />
2018<br />
Oct.<br />
2018<br />
HISPANIC OR LATINO ETHNICITY<br />
Civilian noninstitutional population................ 41,665 42,959 43,054 41,665 42,679 42,767 42,863 42,959 43,054<br />
Civilian labor force................................ 27,328 28,316 28,512 27,319 28,369 28,495 28,242 28,346 28,500<br />
Participation rate............................... 65.6 65.9 66.2 65.6 66.5 66.6 65.9 66.0 66.2<br />
Employed....................................... 26,077 27,105 27,343 25,999 27,077 27,223 26,927 27,059 27,252<br />
Employment-population ratio............... 62.6 63.1 63.5 62.4 63.4 63.7 62.8 63.0 63.3<br />
Unemployed.................................... 1,250 1,211 1,169 1,321 1,292 1,273 1,315 1,287 1,248<br />
<strong>Unemployment</strong> rate......................... 4.6 4.3 4.1 4.8 4.6 4.5 4.7 4.5 4.4<br />
Not in labor force................................. 14,337 14,642 14,542 14,346 14,310 14,272 14,621 14,613 14,554<br />
Men, 20 years and over<br />
Civilian labor force................................ 14,987 15,414 15,442 14,959 15,557 15,519 15,421 15,416 15,440<br />
Participation rate............................... 79.9 79.5 79.4 79.7 80.8 80.4 79.7 79.5 79.4<br />
Employed....................................... 14,459 14,888 14,898 14,380 14,961 15,017 14,849 14,822 14,844<br />
Employment-population ratio............... 77.1 76.8 76.6 76.7 77.7 77.8 76.7 76.4 76.4<br />
Unemployed.................................... 528 526 544 579 596 502 572 594 596<br />
<strong>Unemployment</strong> rate......................... 3.5 3.4 3.5 3.9 3.8 3.2 3.7 3.9 3.9<br />
Women, 20 years and over<br />
Civilian labor force................................ 11,158 11,682 11,778 11,146 11,626 11,684 11,593 11,673 11,756<br />
Participation rate............................... 58.6 59.6 59.9 58.5 59.7 59.8 59.2 59.5 59.8<br />
Employed....................................... 10,639 11,175 11,305 10,601 11,065 11,131 11,009 11,172 11,255<br />
Employment-population ratio............... 55.9 57.0 57.5 55.7 56.8 57.0 56.3 57.0 57.3<br />
Unemployed.................................... 519 507 472 546 561 553 584 501 501<br />
<strong>Unemployment</strong> rate......................... 4.6 4.3 4.0 4.9 4.8 4.7 5.0 4.3 4.3<br />
Both sexes, 16 to 19 years<br />
Civilian labor force................................ 1,184 1,220 1,293 1,214 1,186 1,292 1,228 1,257 1,304<br />
Participation rate............................... 30.6 30.9 32.6 31.4 30.2 32.8 31.1 31.8 32.9<br />
Employed....................................... 980 1,042 1,140 1,018 1,051 1,075 1,068 1,065 1,153<br />
Employment-population ratio............... 25.3 26.3 28.8 26.3 26.7 27.3 27.1 26.9 29.1<br />
Unemployed.................................... 204 179 152 196 135 218 160 192 151<br />
<strong>Unemployment</strong> rate......................... 17.2 14.6 11.8 16.1 11.4 16.8 13.0 15.3 11.6<br />
1 The population figures are not adjusted for seasonal variation; therefore, identical numbers appear in the unadjusted and seasonally adjusted<br />
columns.<br />
NOTE: Persons whose ethnicity is identified as Hispanic or Latino may be of any race. Updated population controls are introduced annually with the<br />
release of January data.


