

Hidden Unemployment
Hidden Unemployment
Hidden Unemployment

Create successful ePaper yourself
Turn your PDF publications into a flip-book with our unique Google optimized e-Paper software.
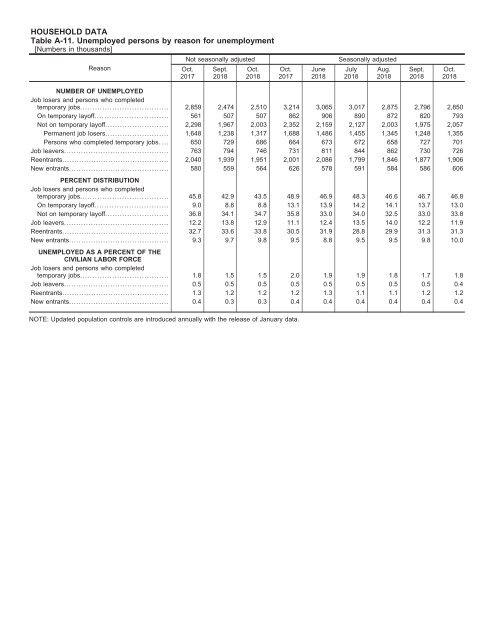
HOUSEHOLD DATA<br />
Table A-11. Unemployed persons by reason for unemployment<br />
[Numbers in thousands]<br />
Reason<br />
Not seasonally adjusted<br />
Oct.<br />
2017<br />
Sept.<br />
2018<br />
Oct.<br />
2018<br />
Oct.<br />
2017<br />
June<br />
2018<br />
Seasonally adjusted<br />
July<br />
2018<br />
Aug.<br />
2018<br />
Sept.<br />
2018<br />
Oct.<br />
2018<br />
NUMBER OF UNEMPLOYED<br />
Job losers and persons who completed<br />
temporary jobs.................................... 2,859 2,474 2,510 3,214 3,065 3,017 2,875 2,796 2,850<br />
On temporary layoff.............................. 561 507 507 862 906 890 872 820 793<br />
Not on temporary layoff.......................... 2,298 1,967 2,003 2,352 2,159 2,127 2,003 1,975 2,057<br />
Permanent job losers.......................... 1,648 1,238 1,317 1,688 1,486 1,455 1,345 1,248 1,355<br />
Persons who completed temporary jobs. . .. 650 729 686 664 673 672 658 727 701<br />
Job leavers........................................... 763 794 746 731 811 844 862 730 726<br />
Reentrants............................................ 2,040 1,939 1,951 2,001 2,086 1,799 1,846 1,877 1,906<br />
New entrants......................................... 580 559 564 626 578 591 584 586 606<br />
PERCENT DISTRIBUTION<br />
Job losers and persons who completed<br />
temporary jobs.................................... 45.8 42.9 43.5 48.9 46.9 48.3 46.6 46.7 46.8<br />
On temporary layoff.............................. 9.0 8.8 8.8 13.1 13.9 14.2 14.1 13.7 13.0<br />
Not on temporary layoff.......................... 36.8 34.1 34.7 35.8 33.0 34.0 32.5 33.0 33.8<br />
Job leavers........................................... 12.2 13.8 12.9 11.1 12.4 13.5 14.0 12.2 11.9<br />
Reentrants............................................ 32.7 33.6 33.8 30.5 31.9 28.8 29.9 31.3 31.3<br />
New entrants......................................... 9.3 9.7 9.8 9.5 8.8 9.5 9.5 9.8 10.0<br />
UNEMPLOYED AS A PERCENT OF THE<br />
CIVILIAN LABOR FORCE<br />
Job losers and persons who completed<br />
temporary jobs.................................... 1.8 1.5 1.5 2.0 1.9 1.9 1.8 1.7 1.8<br />
Job leavers........................................... 0.5 0.5 0.5 0.5 0.5 0.5 0.5 0.5 0.4<br />
Reentrants............................................ 1.3 1.2 1.2 1.2 1.3 1.1 1.1 1.2 1.2<br />
New entrants......................................... 0.4 0.3 0.3 0.4 0.4 0.4 0.4 0.4 0.4<br />
NOTE: Updated population controls are introduced annually with the release of January data.


