

Hidden Unemployment
Hidden Unemployment
Hidden Unemployment

Create successful ePaper yourself
Turn your PDF publications into a flip-book with our unique Google optimized e-Paper software.
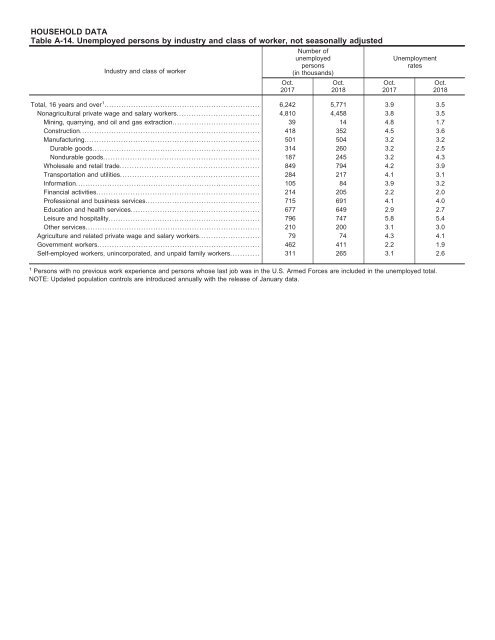
HOUSEHOLD DATA<br />
Table A-14. Unemployed persons by industry and class of worker, not seasonally adjusted<br />
Industry and class of worker<br />
Oct.<br />
2017<br />
Number of<br />
unemployed<br />
persons<br />
(in thousands)<br />
Oct.<br />
2018<br />
Oct.<br />
2017<br />
<strong>Unemployment</strong><br />
rates<br />
Total, 16 years and over 1 ................................................................ 6,242 5,771 3.9 3.5<br />
Nonagricultural private wage and salary workers.................................. 4,810 4,458 3.8 3.5<br />
Mining, quarrying, and oil and gas extraction.................................... 39 14 4.8 1.7<br />
Construction.......................................................................... 418 352 4.5 3.6<br />
Manufacturing........................................................................ 501 504 3.2 3.2<br />
Durable goods..................................................................... 314 260 3.2 2.5<br />
Nondurable goods................................................................ 187 245 3.2 4.3<br />
Wholesale and retail trade......................................................... 849 794 4.2 3.9<br />
Transportation and utilities......................................................... 284 217 4.1 3.1<br />
Information............................................................................ 105 84 3.9 3.2<br />
Financial activities................................................................... 214 205 2.2 2.0<br />
Professional and business services............................................... 715 691 4.1 4.0<br />
Education and health services..................................................... 677 649 2.9 2.7<br />
Leisure and hospitality.............................................................. 796 747 5.8 5.4<br />
Other services........................................................................ 210 200 3.1 3.0<br />
Agriculture and related private wage and salary workers......................... 79 74 4.3 4.1<br />
Government workers................................................................... 462 411 2.2 1.9<br />
Self-employed workers, unincorporated, and unpaid family workers............ 311 265 3.1 2.6<br />
Oct.<br />
2018<br />
1 Persons with no previous work experience and persons whose last job was in the U.S. Armed Forces are included in the unemployed total.<br />
NOTE: Updated population controls are introduced annually with the release of January data.


