

Hidden Unemployment
Hidden Unemployment
Hidden Unemployment

Create successful ePaper yourself
Turn your PDF publications into a flip-book with our unique Google optimized e-Paper software.
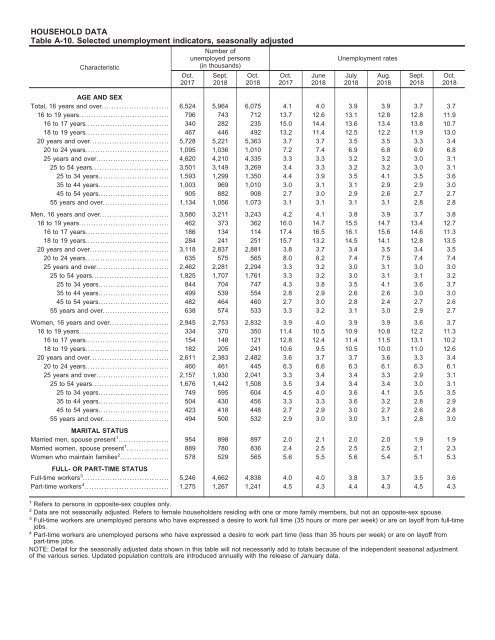
HOUSEHOLD DATA<br />
Table A-10. Selected unemployment indicators, seasonally adjusted<br />
Characteristic<br />
Oct.<br />
2017<br />
Number of<br />
unemployed persons<br />
(in thousands)<br />
Sept.<br />
2018<br />
Oct.<br />
2018<br />
Oct.<br />
2017<br />
June<br />
2018<br />
<strong>Unemployment</strong> rates<br />
July<br />
2018<br />
Aug.<br />
2018<br />
Sept.<br />
2018<br />
Oct.<br />
2018<br />
AGE AND SEX<br />
Total, 16 years and over........................... 6,524 5,964 6,075 4.1 4.0 3.9 3.9 3.7 3.7<br />
16 to 19 years..................................... 796 743 712 13.7 12.6 13.1 12.8 12.8 11.9<br />
16 to 17 years.................................. 340 282 235 15.0 14.4 13.6 13.4 13.8 10.7<br />
18 to 19 years.................................. 467 446 492 13.2 11.4 12.5 12.2 11.9 13.0<br />
20 years and over................................ 5,728 5,221 5,363 3.7 3.7 3.5 3.5 3.3 3.4<br />
20 to 24 years.................................. 1,095 1,036 1,010 7.2 7.4 6.9 6.8 6.9 6.8<br />
25 years and over.............................. 4,620 4,210 4,335 3.3 3.3 3.2 3.2 3.0 3.1<br />
25 to 54 years............................... 3,501 3,149 3,269 3.4 3.3 3.2 3.2 3.0 3.1<br />
25 to 34 years............................. 1,593 1,299 1,350 4.4 3.9 3.5 4.1 3.5 3.6<br />
35 to 44 years............................. 1,003 969 1,010 3.0 3.1 3.1 2.9 2.9 3.0<br />
45 to 54 years............................. 905 882 908 2.7 3.0 2.9 2.6 2.7 2.7<br />
55 years and over........................... 1,134 1,056 1,073 3.1 3.1 3.1 3.1 2.8 2.8<br />
Men, 16 years and over............................ 3,580 3,211 3,243 4.2 4.1 3.8 3.9 3.7 3.8<br />
16 to 19 years..................................... 462 373 362 16.0 14.7 15.5 14.7 13.4 12.7<br />
16 to 17 years.................................. 186 134 114 17.4 16.5 16.1 15.6 14.6 11.3<br />
18 to 19 years.................................. 284 241 251 15.7 13.2 14.5 14.1 12.8 13.5<br />
20 years and over................................ 3,118 2,837 2,881 3.8 3.7 3.4 3.5 3.4 3.5<br />
20 to 24 years.................................. 635 575 565 8.0 8.2 7.4 7.5 7.4 7.4<br />
25 years and over.............................. 2,462 2,281 2,294 3.3 3.2 3.0 3.1 3.0 3.0<br />
25 to 54 years............................... 1,825 1,707 1,761 3.3 3.2 3.0 3.1 3.1 3.2<br />
25 to 34 years............................. 844 704 747 4.3 3.8 3.5 4.1 3.6 3.7<br />
35 to 44 years............................. 499 539 554 2.8 2.9 2.6 2.6 3.0 3.0<br />
45 to 54 years............................. 482 464 460 2.7 3.0 2.8 2.4 2.7 2.6<br />
55 years and over........................... 638 574 533 3.3 3.2 3.1 3.0 2.9 2.7<br />
Women, 16 years and over........................ 2,945 2,753 2,832 3.9 4.0 3.9 3.9 3.6 3.7<br />
16 to 19 years..................................... 334 370 350 11.4 10.5 10.9 10.8 12.2 11.3<br />
16 to 17 years.................................. 154 148 121 12.8 12.4 11.4 11.5 13.1 10.2<br />
18 to 19 years.................................. 182 205 241 10.6 9.5 10.5 10.0 11.0 12.6<br />
20 years and over................................ 2,611 2,383 2,482 3.6 3.7 3.7 3.6 3.3 3.4<br />
20 to 24 years.................................. 460 461 445 6.3 6.6 6.3 6.1 6.3 6.1<br />
25 years and over.............................. 2,157 1,930 2,041 3.3 3.4 3.4 3.3 2.9 3.1<br />
25 to 54 years............................... 1,676 1,442 1,508 3.5 3.4 3.4 3.4 3.0 3.1<br />
25 to 34 years............................. 749 595 604 4.5 4.0 3.6 4.1 3.5 3.5<br />
35 to 44 years............................. 504 430 456 3.3 3.3 3.6 3.2 2.8 2.9<br />
45 to 54 years............................. 423 418 448 2.7 2.9 3.0 2.7 2.6 2.8<br />
55 years and over........................... 494 500 532 2.9 3.0 3.0 3.1 2.8 3.0<br />
MARITAL STATUS<br />
Married men, spouse present 1 .................... 954 898 897 2.0 2.1 2.0 2.0 1.9 1.9<br />
Married women, spouse present 1 ................. 889 780 836 2.4 2.5 2.5 2.5 2.1 2.3<br />
Women who maintain families 2 .................... 578 529 565 5.6 5.5 5.6 5.4 5.1 5.3<br />
FULL- OR PART-TIME STATUS<br />
Full-time workers 3 ................................... 5,246 4,662 4,838 4.0 4.0 3.8 3.7 3.5 3.6<br />
Part-time workers 4 .................................. 1,275 1,267 1,241 4.5 4.3 4.4 4.3 4.5 4.3<br />
1 Refers to persons in opposite-sex couples only.<br />
2 Data are not seasonally adjusted. Refers to female householders residing with one or more family members, but not an opposite-sex spouse.<br />
3 Full-time workers are unemployed persons who have expressed a desire to work full time (35 hours or more per week) or are on layoff from full-time<br />
jobs.<br />
4 Part-time workers are unemployed persons who have expressed a desire to work part time (less than 35 hours per week) or are on layoff from<br />
part-time jobs.<br />
NOTE: Detail for the seasonally adjusted data shown in this table will not necessarily add to totals because of the independent seasonal adjustment<br />
of the various series. Updated population controls are introduced annually with the release of January data.


