

Hidden Unemployment
Hidden Unemployment
Hidden Unemployment

You also want an ePaper? Increase the reach of your titles
YUMPU automatically turns print PDFs into web optimized ePapers that Google loves.
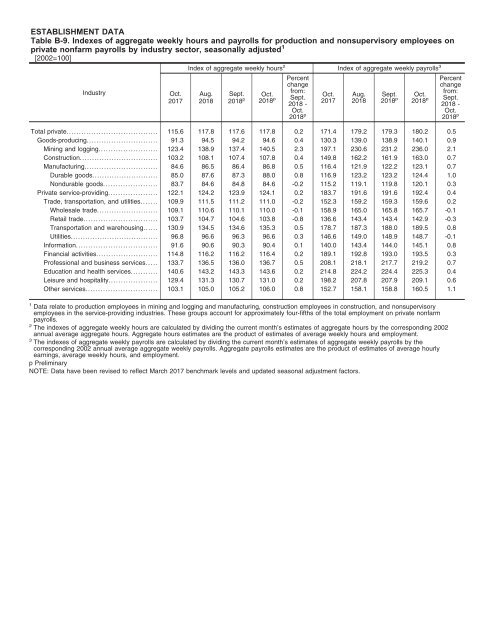
ESTABLISHMENT DATA<br />
Table B-9. Indexes of aggregate weekly hours and payrolls for production and nonsupervisory employees on<br />
private nonfarm payrolls by industry sector, seasonally adjusted 1<br />
[2002=100]<br />
Industry<br />
Oct.<br />
2017<br />
Index of aggregate weekly hours 2 Index of aggregate weekly payrolls 3<br />
Aug.<br />
2018<br />
Percent<br />
change<br />
Sept.<br />
from:<br />
Oct.<br />
2018 p 2018 p 2018 Sept. Oct.<br />
-<br />
2017<br />
Oct.<br />
2018 p<br />
Aug.<br />
2018<br />
Sept.<br />
2018 p Oct.<br />
2018 p Percent<br />
change<br />
from:<br />
2018 -<br />
Oct.<br />
2018 p<br />
Total private..................................... 115.6 117.8 117.6 117.8 0.2 171.4 179.2 179.3 180.2 0.5<br />
Goods-producing............................. 91.3 94.5 94.2 94.6 0.4 130.3 139.0 138.9 140.1 0.9<br />
Mining and logging........................ 123.4 138.9 137.4 140.5 2.3 197.1 230.6 231.2 236.0 2.1<br />
Construction................................ 103.2 108.1 107.4 107.8 0.4 149.8 162.2 161.9 163.0 0.7<br />
Manufacturing.............................. 84.6 86.5 86.4 86.8 0.5 116.4 121.9 122.2 123.1 0.7<br />
Durable goods........................... 85.0 87.6 87.3 88.0 0.8 116.9 123.2 123.2 124.4 1.0<br />
Nondurable goods...................... 83.7 84.6 84.8 84.6 -0.2 115.2 119.1 119.8 120.1 0.3<br />
Private service-providing.................... 122.1 124.2 123.9 124.1 0.2 183.7 191.6 191.6 192.4 0.4<br />
Trade, transportation, and utilities....... 109.9 111.5 111.2 111.0 -0.2 152.3 159.2 159.3 159.6 0.2<br />
Wholesale trade......................... 109.1 110.6 110.1 110.0 -0.1 158.9 165.0 165.8 165.7 -0.1<br />
Retail trade.............................. 103.7 104.7 104.6 103.8 -0.8 136.6 143.4 143.4 142.9 -0.3<br />
Transportation and warehousing...... 130.9 134.5 134.6 135.3 0.5 178.7 187.3 188.0 189.5 0.8<br />
Utilities.................................... 96.8 96.6 96.3 96.6 0.3 146.6 149.0 148.9 148.7 -0.1<br />
Information................................. 91.6 90.6 90.3 90.4 0.1 140.0 143.4 144.0 145.1 0.8<br />
Financial activities......................... 114.8 116.2 116.2 116.4 0.2 189.1 192.8 193.0 193.5 0.3<br />
Professional and business services..... 133.7 136.5 136.0 136.7 0.5 208.1 218.1 217.7 219.2 0.7<br />
Education and health services........... 140.6 143.2 143.3 143.6 0.2 214.8 224.2 224.4 225.3 0.4<br />
Leisure and hospitality.................... 129.4 131.3 130.7 131.0 0.2 198.2 207.8 207.9 209.1 0.6<br />
Other services............................. 103.1 105.0 105.2 106.0 0.8 152.7 158.1 158.8 160.5 1.1<br />
1 Data relate to production employees in mining and logging and manufacturing, construction employees in construction, and nonsupervisory<br />
employees in the service-providing industries. These groups account for approximately four-fifths of the total employment on private nonfarm<br />
payrolls.<br />
2 The indexes of aggregate weekly hours are calculated by dividing the current month’s estimates of aggregate hours by the corresponding 2002<br />
annual average aggregate hours. Aggregate hours estimates are the product of estimates of average weekly hours and employment.<br />
3 The indexes of aggregate weekly payrolls are calculated by dividing the current month’s estimates of aggregate weekly payrolls by the<br />
corresponding 2002 annual average aggregate weekly payrolls. Aggregate payrolls estimates are the product of estimates of average hourly<br />
earnings, average weekly hours, and employment.<br />
p Preliminary<br />
NOTE: Data have been revised to reflect March 2017 benchmark levels and updated seasonal adjustment factors.


