ESTABLISHMENT DATA Table B-1. Employees on nonfarm payrolls by industry sector and selected industry detail — Continued [In thousands] Industry Arts, entertainment, and recreation - Continued Oct. 2017 Not seasonally adjusted Aug. 2018 Sept. Oct. Oct. 2018 p 2018 p 2017 Aug. 2018 Seasonally adjusted Change Sept. Oct. from: 2018 p 2018 p Sept.2018 - Oct.2018 p Museums, historical sites, and similar institutions. . . . . . . . . . . . . . . . . . . . . . . . . . . . . . . . . 168.7 186.6 176.8 176.2 168.0 173.8 174.5 175.5 1.0 Amusements, gambling, and recreation. . . . . 1,625.9 1,950.2 1,724.2 1,646.8 1,680.7 1,690.1 1,690.2 1,694.9 4.7 Accommodation and food services. . . . . . . . . . . . 13,800.5 14,425.3 14,117.4 14,026.1 13,808.4 14,018.7 14,005.1 14,038.1 33.0 Accommodation. . . . . . . . . . . . . . . . . . . . . . . . . . . . . 1,997.9 2,182.8 2,079.1 2,023.0 2,010.4 2,040.3 2,036.7 2,036.2 -0.5 Food services and drinking places. . . . . . . . . . 11,802.6 12,242.5 12,038.3 12,003.1 11,798.0 11,978.4 11,968.4 12,001.9 33.5 Other services. . . . . . . . . . . . . . . . . . . . . . . . . . . . . . . . . . . . 5,808 5,910 5,864 5,886 5,806 5,873 5,877 5,884 7 Repair and maintenance. . . . . . . . . . . . . . . . . . . . . . . 1,312.2 1,323.3 1,324.5 1,328.7 1,311.3 1,323.3 1,324.6 1,327.5 2.9 Personal and laundry services. . . . . . . . . . . . . . . . . 1,502.2 1,536.3 1,533.6 1,543.1 1,499.7 1,530.1 1,534.7 1,539.5 4.8 Membership associations and organizations. . . 2,993.8 3,050.0 3,005.7 3,014.5 2,995.3 3,019.8 3,017.4 3,017.1 -0.3 Government. . . . . . . . . . . . . . . . . . . . . . . . . . . . . . . . . . . . . . . . . . . 22,687 21,420 22,370 22,771 22,331 22,396 22,393 22,397 4 Federal. . . . . . . . . . . . . . . . . . . . . . . . . . . . . . . . . . . . . . . . . . . . . 2,802.0 2,806.0 2,801.0 2,799.0 2,807.0 2,797.0 2,798.0 2,799.0 1.0 Federal, except U.S. Postal Service. . . . . . . . . . . . . 2,187.7 2,202.3 2,196.4 2,194.8 2,190.3 2,191.0 2,191.9 2,194.5 2.6 U.S. Postal Service. . . . . . . . . . . . . . . . . . . . . . . . . . . . . . 614.5 603.6 604.3 603.7 616.9 606.3 605.7 604.9 -0.8 State government. . . . . . . . . . . . . . . . . . . . . . . . . . . . . . . . . . 5,279.0 4,863.0 5,194.0 5,297.0 5,135.0 5,137.0 5,138.0 5,139.0 1.0 State government education. . . . . . . . . . . . . . . . . . . . . 2,616.1 2,180.8 2,527.6 2,641.1 2,462.7 2,472.3 2,473.6 2,474.9 1.3 State government, excluding education. . . . . . . . . . 2,662.7 2,682.5 2,666.5 2,656.0 2,671.8 2,664.4 2,664.8 2,663.7 -1.1 Local government. . . . . . . . . . . . . . . . . . . . . . . . . . . . . . . . . . 14,606.0 13,751.0 14,375.0 14,675.0 14,389.0 14,462.0 14,457.0 14,459.0 2.0 Local government education. . . . . . . . . . . . . . . . . . . . . 8,190.6 7,079.3 7,895.2 8,226.5 7,936.7 7,974.0 7,968.9 7,968.7 -0.2 Local government, excluding education. . . . . . . . . . 6,415.6 6,671.3 6,479.6 6,448.7 6,452.0 6,488.3 6,488.3 6,490.1 1.8 1 Includes other industries, not shown separately. 2 Includes motor vehicles, motor vehicle bodies and trailers, and motor vehicle parts. 3 Includes ambulatory health care services, hospitals, and nursing and residential care facilities. p Preliminary NOTE: Data have been revised to reflect March 2017 benchmark levels and updated seasonal adjustment factors.
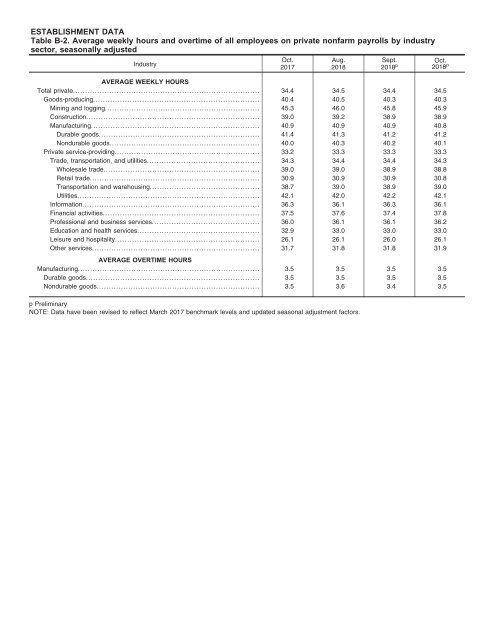
ESTABLISHMENT DATA Table B-2. Average weekly hours and overtime of all employees on private nonfarm payrolls by industry sector, seasonally adjusted Industry Oct. 2017 Aug. 2018 Sept. 2018 p Oct. 2018 p AVERAGE WEEKLY HOURS Total private............................................................................. 34.4 34.5 34.4 34.5 Goods-producing.................................................................... 40.4 40.5 40.3 40.3 Mining and logging................................................................ 45.3 46.0 45.8 45.9 Construction....................................................................... 39.0 39.2 38.9 38.9 Manufacturing..................................................................... 40.9 40.9 40.9 40.8 Durable goods.................................................................. 41.4 41.3 41.2 41.2 Nondurable goods.............................................................. 40.0 40.3 40.2 40.1 Private service-providing............................................................ 33.2 33.3 33.3 33.3 Trade, transportation, and utilities.............................................. 34.3 34.4 34.4 34.3 Wholesale trade................................................................ 39.0 39.0 38.9 38.8 Retail trade...................................................................... 30.9 30.9 30.9 30.8 Transportation and warehousing............................................. 38.7 39.0 38.9 39.0 Utilities........................................................................... 42.1 42.0 42.2 42.1 Information......................................................................... 36.3 36.1 36.3 36.1 Financial activities................................................................ 37.5 37.6 37.4 37.8 Professional and business services............................................ 36.0 36.1 36.1 36.2 Education and health services.................................................. 32.9 33.0 33.0 33.0 Leisure and hospitality........................................................... 26.1 26.1 26.0 26.1 Other services..................................................................... 31.7 31.8 31.8 31.9 AVERAGE OVERTIME HOURS Manufacturing........................................................................... 3.5 3.5 3.5 3.5 Durable goods....................................................................... 3.5 3.5 3.5 3.5 Nondurable goods................................................................... 3.5 3.6 3.4 3.5 p Preliminary NOTE: Data have been revised to reflect March 2017 benchmark levels and updated seasonal adjustment factors.
- Page 1 and 2:
The e-Advocate Monthly …a Compend
- Page 3 and 4:
The Advocacy Foundation, Inc. Helpi
- Page 5 and 6:
The Transformative Justice Project
- Page 7 and 8:
1. The national average cost to tax
- Page 9 and 10:
The Advocacy Foundation, Inc. Helpi
- Page 11 and 12:
Biblical Authority ______ Leviticus
- Page 13 and 14:
Table of Contents …a compilation
- Page 15 and 16:
I. Introduction The Unemployment Ra
- Page 17 and 18:
On the other hand, cyclical unemplo
- Page 19 and 20:
Marxian Theory of Unemployment It i
- Page 21 and 22:
To the extent that hidden unemploym
- Page 23 and 24:
to the way the statistics are colle
- Page 25 and 26:
calculation of unemployment by diff
- Page 27 and 28:
The Bureau of Labor Statistics also
- Page 29 and 30:
When comparing unemployment rates b
- Page 31 and 32:
In the United States, there have be
- Page 33 and 34:
Unemployment Ratio The unemployment
- Page 35 and 36:
Another cost for the unemployed is
- Page 37 and 38:
of millions and the destruction of
- Page 39 and 40:
Decline In Work Hours As a result o
- Page 41 and 42:
According to classical economic the
- Page 43 and 44:
A description of the miserable livi
- Page 45 and 46:
20% in some parts of the United Kin
- Page 47 and 48:
Male Unemployment Male Unemployment
- Page 49 and 50:
II. The Effective (True) Unemployme
- Page 51 and 52:
U.S. Unemployment Forecast 2017 Sug
- Page 53 and 54:
not causation but, if traditionally
- Page 55 and 56:
So, what has really changed? Yes, t
- Page 57 and 58:
numbers, more dramatic solutions ar
- Page 59 and 60:
As I look back and reflect on my ex
- Page 61 and 62:
III. Involuntary Unemployment Invol
- Page 63 and 64:
Other economists do not believe tha
- Page 65 and 66:
IV. Underemployment Underemployment
- Page 67 and 68:
surveys show that skill-based under
- Page 69 and 70:
In some countries, labour laws or p
- Page 71 and 72:
V. Discouraged Workers In economics
- Page 73 and 74:
European Union Unemployment statist
- Page 75 and 76:
VI. The Working Poor The Working Po
- Page 77 and 78:
Measuring Working Poverty Absolute
- Page 79 and 80:
nearly 40% -- or more than $60,000
- Page 81 and 82:
affects a very wide range of people
- Page 83 and 84:
Welfare State Generosity Cross-nati
- Page 85 and 86:
available education continues the v
- Page 87 and 88:
mechanisms that allow them to maint
- Page 89 and 90:
Education And Training Some argue t
- Page 91 and 92:
VII. Wage Slavery Wage Slavery is a
- Page 93 and 94:
might 'come and go' as he pleased,
- Page 95 and 96:
5. Similarities were blurred by the
- Page 97 and 98:
development of economic theory. Ada
- Page 99 and 100: Psychological Effects According to
- Page 101 and 102: have a range of available alternati
- Page 103 and 104: Modern political theory stresses Ma
- Page 105 and 106: Others like Murray Rothbard allow f
- Page 107 and 108: VIII. The Employment-to-Population
- Page 109 and 110: Employment-To-Population Ratio in T
- Page 111 and 112: Co un try Turk ey Unit ed King dom
- Page 113 and 114: IX. List of Countries by Employment
- Page 115 and 116: X. References 1. https://en.wikiped
- Page 117 and 118: Notes _____________________________
- Page 119 and 120: Attachment A The Unemployment Situa
- Page 121 and 122: Household Survey Data The unemploym
- Page 123 and 124: HOUSEHOLD DATA Summary table A. Hou
- Page 125 and 126: Frequently Asked Questions about Em
- Page 127 and 128: Technical Note This news release pr
- Page 129 and 130: estimation in order to offset the m
- Page 131 and 132: HOUSEHOLD DATA Table A-2. Employmen
- Page 133 and 134: HOUSEHOLD DATA Table A-3. Employmen
- Page 135 and 136: HOUSEHOLD DATA Table A-5. Employmen
- Page 137 and 138: HOUSEHOLD DATA Table A-7. Employmen
- Page 139 and 140: HOUSEHOLD DATA Table A-9. Selected
- Page 141 and 142: HOUSEHOLD DATA Table A-11. Unemploy
- Page 143 and 144: HOUSEHOLD DATA Table A-13. Employed
- Page 145 and 146: HOUSEHOLD DATA Table A-15. Alternat
- Page 147 and 148: ESTABLISHMENT DATA Table B-1. Emplo
- Page 149: ESTABLISHMENT DATA Table B-1. Emplo
- Page 153 and 154: ESTABLISHMENT DATA Table B-4. Index
- Page 155 and 156: ESTABLISHMENT DATA Table B-6. Emplo
- Page 157 and 158: ESTABLISHMENT DATA Table B-8. Avera
- Page 159 and 160: Page 120 of 149
- Page 161 and 162: For release 10:00 a.m. (EDT) Thursd
- Page 163 and 164: Technical Note The estimates in thi
- Page 165 and 166: Table 1. Employment status of the c
- Page 167 and 168: Table 2. Employment status of the c
- Page 169 and 170: Page 122 of 149
- Page 171 and 172: URBAN INSTITUTE 2100 M Street, NW W
- Page 173 and 174: Contents Challenges to Measuring Ef
- Page 175 and 176: negative effects in many areas, sta
- Page 177 and 178: long-term unemployed workers were a
- Page 179 and 180: Selection and screening both play a
- Page 181 and 182: human capital of the individual. Lo
- Page 183 and 184: and Oswald (1994) found duration of
- Page 185 and 186: high crime. As long-term unemployme
- Page 187 and 188: References Barnette, Justin, and Am
- Page 189 and 190: Kroft, Kory, Fabian Lange, and Matt
- Page 191 and 192: Page 124 of 149
- Page 193 and 194: Advocacy Foundation Publishers The
- Page 195 and 196: XVI for Drug-Free Communities Landm
- Page 197 and 198: Vol. VIII 2022 ComeUnity ReEngineer
- Page 199 and 200: Vol. XV 2029 Inner-Cities Revitaliz
- Page 201 and 202:
The e-Advocate Monthly Review 2018
- Page 203 and 204:
2021 Biblically Responsible Investi
- Page 205 and 206:
The e-Advocate Journal of Theologic
- Page 207 and 208:
Issue Title Quarterly Vol. I 2015 I
- Page 209 and 210:
The e-Advocate Juvenile Justice Rep
- Page 211 and 212:
2018 - The Theological Law Firm Aca
- Page 213 and 214:
Page 146 of 149
- Page 215 and 216:
www.TheAdvocacy.Foundation Page 148