

Hidden Unemployment
Hidden Unemployment
Hidden Unemployment

You also want an ePaper? Increase the reach of your titles
YUMPU automatically turns print PDFs into web optimized ePapers that Google loves.
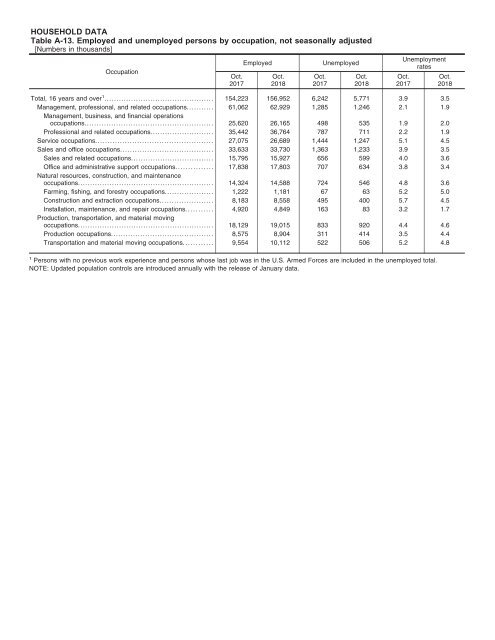
HOUSEHOLD DATA<br />
Table A-13. Employed and unemployed persons by occupation, not seasonally adjusted<br />
[Numbers in thousands]<br />
Occupation<br />
Oct.<br />
2017<br />
Employed<br />
Oct.<br />
2018<br />
Oct.<br />
2017<br />
Unemployed<br />
Oct.<br />
2018<br />
<strong>Unemployment</strong><br />
rates<br />
Oct.<br />
2017<br />
Oct.<br />
2018<br />
Total, 16 years and over 1 ............................................. 154,223 156,952 6,242 5,771 3.9 3.5<br />
Management, professional, and related occupations........... 61,062 62,929 1,285 1,246 2.1 1.9<br />
Management, business, and financial operations<br />
occupations..................................................... 25,620 26,165 498 535 1.9 2.0<br />
Professional and related occupations.......................... 35,442 36,764 787 711 2.2 1.9<br />
Service occupations................................................ 27,075 26,689 1,444 1,247 5.1 4.5<br />
Sales and office occupations...................................... 33,633 33,730 1,363 1,233 3.9 3.5<br />
Sales and related occupations.................................. 15,795 15,927 656 599 4.0 3.6<br />
Office and administrative support occupations............... 17,838 17,803 707 634 3.8 3.4<br />
Natural resources, construction, and maintenance<br />
occupations........................................................ 14,324 14,588 724 546 4.8 3.6<br />
Farming, fishing, and forestry occupations.................... 1,222 1,181 67 63 5.2 5.0<br />
Construction and extraction occupations...................... 8,183 8,558 495 400 5.7 4.5<br />
Installation, maintenance, and repair occupations........... 4,920 4,849 163 83 3.2 1.7<br />
Production, transportation, and material moving<br />
occupations........................................................ 18,129 19,015 833 920 4.4 4.6<br />
Production occupations.......................................... 8,575 8,904 311 414 3.5 4.4<br />
Transportation and material moving occupations............ 9,554 10,112 522 506 5.2 4.8<br />
1 Persons with no previous work experience and persons whose last job was in the U.S. Armed Forces are included in the unemployed total.<br />
NOTE: Updated population controls are introduced annually with the release of January data.


