Table 2. Employment status of the civilian noninstitutional population 16 to 24 years of age by sex, race, and Hispanic or Latino ethnicity, July 2015-2018 [Numbers in thousands. Data are not seasonally adjusted.] Employment status, sex, race, and Hispanic or Latino ethnicity TOTAL Civilian noninstitutional population...................................................... 38,589 38,450 38,152 37,997 Civilian labor force..................................................................... 23,162 23,104 23,107 23,016 Participation rate..................................................................... 60.0 60.1 60.6 60.6 Employed............................................................................. 20,333 20,456 20,890 20,897 Employment-population ratio.................................................... 52.7 53.2 54.8 55.0 Unemployed.......................................................................... 2,829 2,648 2,217 2,119 Looking for full-time work........................................................ 2,134 1,912 1,607 1,458 Looking for part-time work....................................................... 695 736 610 660 <strong>Unemployment</strong> rate................................................................. 12.2 11.5 9.6 9.2 Not in labor force....................................................................... 15,426 15,346 15,045 14,981 Men Civilian noninstitutional population...................................................... 19,442 19,380 19,219 19,128 Civilian labor force..................................................................... 12,011 12,094 11,983 11,695 Participation rate..................................................................... 61.8 62.4 62.3 61.1 Employed............................................................................. 10,488 10,638 10,773 10,550 Employment-population ratio.................................................... 53.9 54.9 56.1 55.2 Unemployed.......................................................................... 1,523 1,455 1,210 1,145 Looking for full-time work........................................................ 1,195 1,169 944 828 Looking for part-time work....................................................... 328 286 266 317 <strong>Unemployment</strong> rate................................................................. 12.7 12.0 10.1 9.8 Not in labor force....................................................................... 7,431 7,287 7,236 7,433 Women Civilian noninstitutional population...................................................... 19,147 19,069 18,932 18,869 Civilian labor force..................................................................... 11,151 11,010 11,124 11,321 Participation rate..................................................................... 58.2 57.7 58.8 60.0 Employed............................................................................. 9,846 9,818 10,117 10,347 Employment-population ratio.................................................... 51.4 51.5 53.4 54.8 Unemployed.......................................................................... 1,306 1,193 1,007 974 Looking for full-time work........................................................ 939 743 663 630 Looking for part-time work....................................................... 367 450 344 344 <strong>Unemployment</strong> rate................................................................. 11.7 10.8 9.1 8.6 Not in labor force....................................................................... 7,996 8,059 7,808 7,548 White Civilian noninstitutional population...................................................... 28,488 28,297 28,038 27,866 Civilian labor force..................................................................... 17,735 17,734 17,423 17,509 Participation rate..................................................................... 62.3 62.7 62.1 62.8 Employed............................................................................. 15,903 15,981 16,031 16,174 Employment-population ratio.................................................... 55.8 56.5 57.2 58.0 Unemployed.......................................................................... 1,832 1,754 1,392 1,335 Looking for full-time work........................................................ 1,308 1,222 974 863 Looking for part-time work....................................................... 524 532 418 471 <strong>Unemployment</strong> rate................................................................. 10.3 9.9 8.0 7.6 Not in labor force....................................................................... 10,754 10,562 10,615 10,357 Black or African American Civilian noninstitutional population...................................................... 5,916 5,850 5,749 5,668 Civilian labor force..................................................................... 3,337 3,149 3,214 3,203 Participation rate..................................................................... 56.4 53.8 55.9 56.5 Employed............................................................................. 2,645 2,499 2,694 2,675 Employment-population ratio.................................................... 44.7 42.7 46.9 47.2 Unemployed.......................................................................... 691 650 520 528 Looking for full-time work........................................................ 604 533 412 438 Looking for part-time work....................................................... 87 117 108 90 <strong>Unemployment</strong> rate................................................................. 20.7 20.6 16.2 16.5 Not in labor force....................................................................... 2,580 2,701 2,535 2,465 July 2015 July 2016 July 2017 July 2018
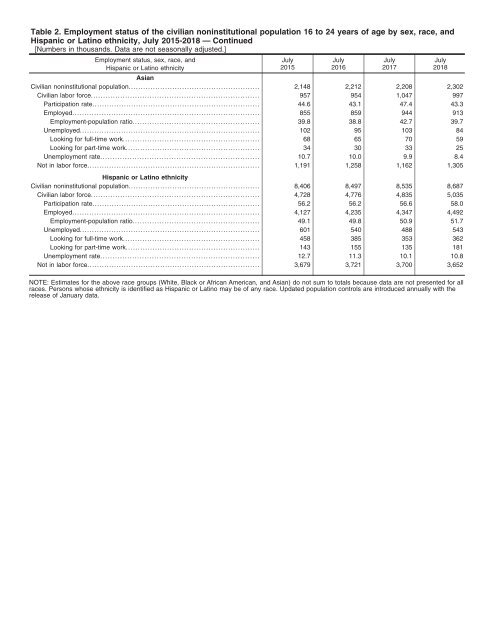
Table 2. Employment status of the civilian noninstitutional population 16 to 24 years of age by sex, race, and Hispanic or Latino ethnicity, July 2015-2018 — Continued [Numbers in thousands. Data are not seasonally adjusted.] Employment status, sex, race, and Hispanic or Latino ethnicity Asian Civilian noninstitutional population...................................................... 2,148 2,212 2,208 2,302 Civilian labor force..................................................................... 957 954 1,047 997 Participation rate..................................................................... 44.6 43.1 47.4 43.3 Employed............................................................................. 855 859 944 913 Employment-population ratio.................................................... 39.8 38.8 42.7 39.7 Unemployed.......................................................................... 102 95 103 84 Looking for full-time work........................................................ 68 65 70 59 Looking for part-time work....................................................... 34 30 33 25 <strong>Unemployment</strong> rate................................................................. 10.7 10.0 9.9 8.4 Not in labor force....................................................................... 1,191 1,258 1,162 1,305 Hispanic or Latino ethnicity Civilian noninstitutional population...................................................... 8,406 8,497 8,535 8,687 Civilian labor force..................................................................... 4,728 4,776 4,835 5,035 Participation rate..................................................................... 56.2 56.2 56.6 58.0 Employed............................................................................. 4,127 4,235 4,347 4,492 Employment-population ratio.................................................... 49.1 49.8 50.9 51.7 Unemployed.......................................................................... 601 540 488 543 Looking for full-time work........................................................ 458 385 353 362 Looking for part-time work....................................................... 143 155 135 181 <strong>Unemployment</strong> rate................................................................. 12.7 11.3 10.1 10.8 Not in labor force....................................................................... 3,679 3,721 3,700 3,652 NOTE: Estimates for the above race groups (White, Black or African American, and Asian) do not sum to totals because data are not presented for all races. Persons whose ethnicity is identified as Hispanic or Latino may be of any race. Updated population controls are introduced annually with the release of January data. July 2015 July 2016 July 2017 July 2018
- Page 1 and 2:
The e-Advocate Monthly …a Compend
- Page 3 and 4:
The Advocacy Foundation, Inc. Helpi
- Page 5 and 6:
The Transformative Justice Project
- Page 7 and 8:
1. The national average cost to tax
- Page 9 and 10:
The Advocacy Foundation, Inc. Helpi
- Page 11 and 12:
Biblical Authority ______ Leviticus
- Page 13 and 14:
Table of Contents …a compilation
- Page 15 and 16:
I. Introduction The Unemployment Ra
- Page 17 and 18:
On the other hand, cyclical unemplo
- Page 19 and 20:
Marxian Theory of Unemployment It i
- Page 21 and 22:
To the extent that hidden unemploym
- Page 23 and 24:
to the way the statistics are colle
- Page 25 and 26:
calculation of unemployment by diff
- Page 27 and 28:
The Bureau of Labor Statistics also
- Page 29 and 30:
When comparing unemployment rates b
- Page 31 and 32:
In the United States, there have be
- Page 33 and 34:
Unemployment Ratio The unemployment
- Page 35 and 36:
Another cost for the unemployed is
- Page 37 and 38:
of millions and the destruction of
- Page 39 and 40:
Decline In Work Hours As a result o
- Page 41 and 42:
According to classical economic the
- Page 43 and 44:
A description of the miserable livi
- Page 45 and 46:
20% in some parts of the United Kin
- Page 47 and 48:
Male Unemployment Male Unemployment
- Page 49 and 50:
II. The Effective (True) Unemployme
- Page 51 and 52:
U.S. Unemployment Forecast 2017 Sug
- Page 53 and 54:
not causation but, if traditionally
- Page 55 and 56:
So, what has really changed? Yes, t
- Page 57 and 58:
numbers, more dramatic solutions ar
- Page 59 and 60:
As I look back and reflect on my ex
- Page 61 and 62:
III. Involuntary Unemployment Invol
- Page 63 and 64:
Other economists do not believe tha
- Page 65 and 66:
IV. Underemployment Underemployment
- Page 67 and 68:
surveys show that skill-based under
- Page 69 and 70:
In some countries, labour laws or p
- Page 71 and 72:
V. Discouraged Workers In economics
- Page 73 and 74:
European Union Unemployment statist
- Page 75 and 76:
VI. The Working Poor The Working Po
- Page 77 and 78:
Measuring Working Poverty Absolute
- Page 79 and 80:
nearly 40% -- or more than $60,000
- Page 81 and 82:
affects a very wide range of people
- Page 83 and 84:
Welfare State Generosity Cross-nati
- Page 85 and 86:
available education continues the v
- Page 87 and 88:
mechanisms that allow them to maint
- Page 89 and 90:
Education And Training Some argue t
- Page 91 and 92:
VII. Wage Slavery Wage Slavery is a
- Page 93 and 94:
might 'come and go' as he pleased,
- Page 95 and 96:
5. Similarities were blurred by the
- Page 97 and 98:
development of economic theory. Ada
- Page 99 and 100:
Psychological Effects According to
- Page 101 and 102:
have a range of available alternati
- Page 103 and 104:
Modern political theory stresses Ma
- Page 105 and 106:
Others like Murray Rothbard allow f
- Page 107 and 108:
VIII. The Employment-to-Population
- Page 109 and 110:
Employment-To-Population Ratio in T
- Page 111 and 112:
Co un try Turk ey Unit ed King dom
- Page 113 and 114:
IX. List of Countries by Employment
- Page 115 and 116: X. References 1. https://en.wikiped
- Page 117 and 118: Notes _____________________________
- Page 119 and 120: Attachment A The Unemployment Situa
- Page 121 and 122: Household Survey Data The unemploym
- Page 123 and 124: HOUSEHOLD DATA Summary table A. Hou
- Page 125 and 126: Frequently Asked Questions about Em
- Page 127 and 128: Technical Note This news release pr
- Page 129 and 130: estimation in order to offset the m
- Page 131 and 132: HOUSEHOLD DATA Table A-2. Employmen
- Page 133 and 134: HOUSEHOLD DATA Table A-3. Employmen
- Page 135 and 136: HOUSEHOLD DATA Table A-5. Employmen
- Page 137 and 138: HOUSEHOLD DATA Table A-7. Employmen
- Page 139 and 140: HOUSEHOLD DATA Table A-9. Selected
- Page 141 and 142: HOUSEHOLD DATA Table A-11. Unemploy
- Page 143 and 144: HOUSEHOLD DATA Table A-13. Employed
- Page 145 and 146: HOUSEHOLD DATA Table A-15. Alternat
- Page 147 and 148: ESTABLISHMENT DATA Table B-1. Emplo
- Page 149 and 150: ESTABLISHMENT DATA Table B-1. Emplo
- Page 151 and 152: ESTABLISHMENT DATA Table B-2. Avera
- Page 153 and 154: ESTABLISHMENT DATA Table B-4. Index
- Page 155 and 156: ESTABLISHMENT DATA Table B-6. Emplo
- Page 157 and 158: ESTABLISHMENT DATA Table B-8. Avera
- Page 159 and 160: Page 120 of 149
- Page 161 and 162: For release 10:00 a.m. (EDT) Thursd
- Page 163 and 164: Technical Note The estimates in thi
- Page 165: Table 1. Employment status of the c
- Page 169 and 170: Page 122 of 149
- Page 171 and 172: URBAN INSTITUTE 2100 M Street, NW W
- Page 173 and 174: Contents Challenges to Measuring Ef
- Page 175 and 176: negative effects in many areas, sta
- Page 177 and 178: long-term unemployed workers were a
- Page 179 and 180: Selection and screening both play a
- Page 181 and 182: human capital of the individual. Lo
- Page 183 and 184: and Oswald (1994) found duration of
- Page 185 and 186: high crime. As long-term unemployme
- Page 187 and 188: References Barnette, Justin, and Am
- Page 189 and 190: Kroft, Kory, Fabian Lange, and Matt
- Page 191 and 192: Page 124 of 149
- Page 193 and 194: Advocacy Foundation Publishers The
- Page 195 and 196: XVI for Drug-Free Communities Landm
- Page 197 and 198: Vol. VIII 2022 ComeUnity ReEngineer
- Page 199 and 200: Vol. XV 2029 Inner-Cities Revitaliz
- Page 201 and 202: The e-Advocate Monthly Review 2018
- Page 203 and 204: 2021 Biblically Responsible Investi
- Page 205 and 206: The e-Advocate Journal of Theologic
- Page 207 and 208: Issue Title Quarterly Vol. I 2015 I
- Page 209 and 210: The e-Advocate Juvenile Justice Rep
- Page 211 and 212: 2018 - The Theological Law Firm Aca
- Page 213 and 214: Page 146 of 149
- Page 215 and 216: www.TheAdvocacy.Foundation Page 148