

Hidden Unemployment
Hidden Unemployment
Hidden Unemployment

You also want an ePaper? Increase the reach of your titles
YUMPU automatically turns print PDFs into web optimized ePapers that Google loves.
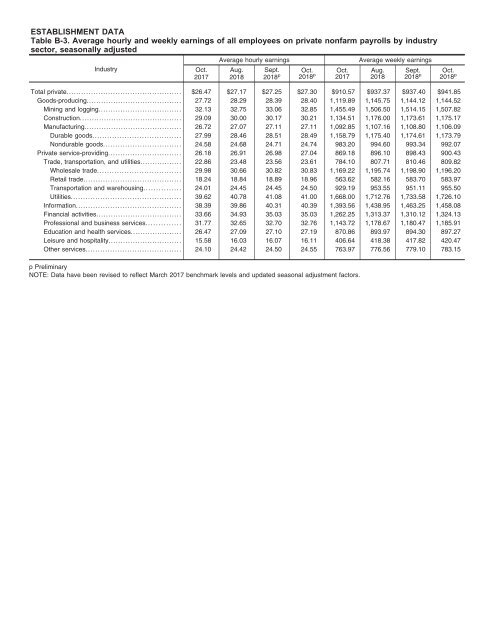
ESTABLISHMENT DATA<br />
Table B-3. Average hourly and weekly earnings of all employees on private nonfarm payrolls by industry<br />
sector, seasonally adjusted<br />
Industry<br />
Oct.<br />
2017<br />
Average hourly earnings<br />
Aug.<br />
2018<br />
Sept. Oct. Oct.<br />
2018 p 2018 p 2017<br />
Average weekly earnings<br />
Aug.<br />
2018<br />
Sept. Oct.<br />
2018 p 2018 p<br />
Total private............................................... $26.47 $27.17 $27.25 $27.30 $910.57 $937.37 $937.40 $941.85<br />
Goods-producing....................................... 27.72 28.29 28.39 28.40 1,119.89 1,145.75 1,144.12 1,144.52<br />
Mining and logging.................................. 32.13 32.75 33.06 32.85 1,455.49 1,506.50 1,514.15 1,507.82<br />
Construction.......................................... 29.09 30.00 30.17 30.21 1,134.51 1,176.00 1,173.61 1,175.17<br />
Manufacturing........................................ 26.72 27.07 27.11 27.11 1,092.85 1,107.16 1,108.80 1,106.09<br />
Durable goods.................................... 27.99 28.46 28.51 28.49 1,158.79 1,175.40 1,174.61 1,173.79<br />
Nondurable goods................................ 24.58 24.68 24.71 24.74 983.20 994.60 993.34 992.07<br />
Private service-providing.............................. 26.18 26.91 26.98 27.04 869.18 896.10 898.43 900.43<br />
Trade, transportation, and utilities................. 22.86 23.48 23.56 23.61 784.10 807.71 810.46 809.82<br />
Wholesale trade.................................. 29.98 30.66 30.82 30.83 1,169.22 1,195.74 1,198.90 1,196.20<br />
Retail trade........................................ 18.24 18.84 18.89 18.96 563.62 582.16 583.70 583.97<br />
Transportation and warehousing............... 24.01 24.45 24.45 24.50 929.19 953.55 951.11 955.50<br />
Utilities............................................. 39.62 40.78 41.08 41.00 1,668.00 1,712.76 1,733.58 1,726.10<br />
Information........................................... 38.39 39.86 40.31 40.39 1,393.56 1,438.95 1,463.25 1,458.08<br />
Financial activities................................... 33.66 34.93 35.03 35.03 1,262.25 1,313.37 1,310.12 1,324.13<br />
Professional and business services.............. 31.77 32.65 32.70 32.76 1,143.72 1,178.67 1,180.47 1,185.91<br />
Education and health services..................... 26.47 27.09 27.10 27.19 870.86 893.97 894.30 897.27<br />
Leisure and hospitality.............................. 15.58 16.03 16.07 16.11 406.64 418.38 417.82 420.47<br />
Other services....................................... 24.10 24.42 24.50 24.55 763.97 776.56 779.10 783.15<br />
p Preliminary<br />
NOTE: Data have been revised to reflect March 2017 benchmark levels and updated seasonal adjustment factors.


