

Hidden Unemployment
Hidden Unemployment
Hidden Unemployment

Create successful ePaper yourself
Turn your PDF publications into a flip-book with our unique Google optimized e-Paper software.
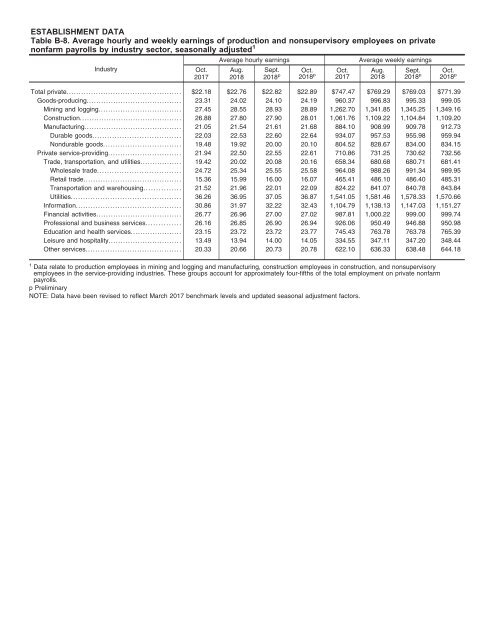
ESTABLISHMENT DATA<br />
Table B-8. Average hourly and weekly earnings of production and nonsupervisory employees on private<br />
nonfarm payrolls by industry sector, seasonally adjusted 1<br />
Industry<br />
Oct.<br />
2017<br />
Average hourly earnings<br />
Aug.<br />
2018<br />
Sept. Oct. Oct.<br />
2018 p 2018 p 2017<br />
Average weekly earnings<br />
Aug.<br />
2018<br />
Sept. Oct.<br />
2018 p 2018 p<br />
Total private............................................... $22.18 $22.76 $22.82 $22.89 $747.47 $769.29 $769.03 $771.39<br />
Goods-producing....................................... 23.31 24.02 24.10 24.19 960.37 996.83 995.33 999.05<br />
Mining and logging.................................. 27.45 28.55 28.93 28.89 1,262.70 1,341.85 1,345.25 1,349.16<br />
Construction.......................................... 26.88 27.80 27.90 28.01 1,061.76 1,109.22 1,104.84 1,109.20<br />
Manufacturing........................................ 21.05 21.54 21.61 21.68 884.10 908.99 909.78 912.73<br />
Durable goods.................................... 22.03 22.53 22.60 22.64 934.07 957.53 955.98 959.94<br />
Nondurable goods................................ 19.48 19.92 20.00 20.10 804.52 828.67 834.00 834.15<br />
Private service-providing.............................. 21.94 22.50 22.55 22.61 710.86 731.25 730.62 732.56<br />
Trade, transportation, and utilities................. 19.42 20.02 20.08 20.16 658.34 680.68 680.71 681.41<br />
Wholesale trade.................................. 24.72 25.34 25.55 25.58 964.08 988.26 991.34 989.95<br />
Retail trade........................................ 15.36 15.99 16.00 16.07 465.41 486.10 486.40 485.31<br />
Transportation and warehousing............... 21.52 21.96 22.01 22.09 824.22 841.07 840.78 843.84<br />
Utilities............................................. 36.26 36.95 37.05 36.87 1,541.05 1,581.46 1,578.33 1,570.66<br />
Information........................................... 30.86 31.97 32.22 32.43 1,104.79 1,138.13 1,147.03 1,151.27<br />
Financial activities................................... 26.77 26.96 27.00 27.02 987.81 1,000.22 999.00 999.74<br />
Professional and business services.............. 26.16 26.85 26.90 26.94 926.06 950.49 946.88 950.98<br />
Education and health services..................... 23.15 23.72 23.72 23.77 745.43 763.78 763.78 765.39<br />
Leisure and hospitality.............................. 13.49 13.94 14.00 14.05 334.55 347.11 347.20 348.44<br />
Other services....................................... 20.33 20.66 20.73 20.78 622.10 636.33 638.48 644.18<br />
1 Data relate to production employees in mining and logging and manufacturing, construction employees in construction, and nonsupervisory<br />
employees in the service-providing industries. These groups account for approximately four-fifths of the total employment on private nonfarm<br />
payrolls.<br />
p Preliminary<br />
NOTE: Data have been revised to reflect March 2017 benchmark levels and updated seasonal adjustment factors.


