Boxoffice - May 2019
The Official Magazine of the National Association of Theatre Owners
The Official Magazine of the National Association of Theatre Owners

You also want an ePaper? Increase the reach of your titles
YUMPU automatically turns print PDFs into web optimized ePapers that Google loves.
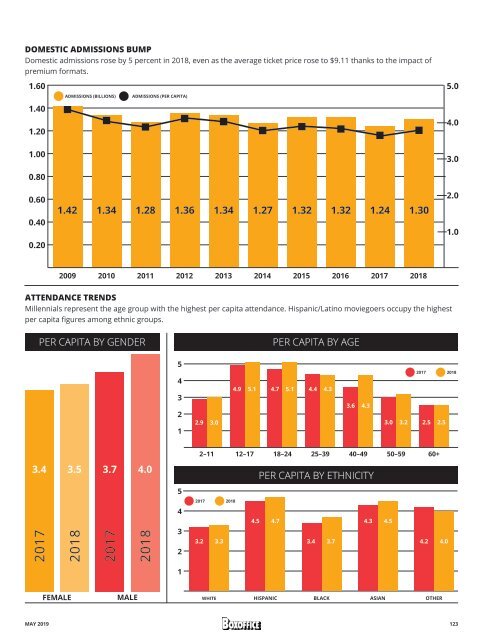
DOMESTIC ADMISSIONS BUMP<br />
Domestic admissions rose by 5 percent in 2018, even as the average ticket price rose to $9.11 thanks to the impact of<br />
premium formats.<br />
1.60<br />
5.0<br />
ADMISSIONS (BILLIONS)<br />
ADMISSIONS (PER CAPITA)<br />
1.40<br />
1.20<br />
4.0<br />
1.00<br />
3.0<br />
0.80<br />
0.60<br />
0.40<br />
0.20<br />
1.42 1.34 1.28 1.36 1.34 1.27 1.32 1.32 1.24 1.30<br />
2.0<br />
1.0<br />
2009 2010 2011 2012 2013 2014 2015 2016 2017 2018<br />
ATTENDANCE TRENDS<br />
Millennials represent the age group with the highest per capita attendance. Hispanic/Latino moviegoers occupy the highest<br />
per capita figures among ethnic groups.<br />
PER CAPITA BY GENDER<br />
PER CAPITA BY AGE<br />
5<br />
4<br />
3<br />
2<br />
1<br />
2.9 3.0<br />
4.9 5.1 4.7 5.1 4.4 4.3<br />
3.6 4.3<br />
2017 2018<br />
3.0 3.2 2.5 2.5<br />
3.4 3.5 3.7 4.0<br />
2017<br />
2018<br />
2017<br />
2018<br />
5<br />
4<br />
3<br />
2<br />
2–11 12–17 18–24 25–39 40–49 50–59 60+<br />
2017 2018<br />
PER CAPITA BY ETHNICITY<br />
4.5 4.7 4.3 4.5<br />
3.2 3.3 3.4 3.7<br />
4.2 4.0<br />
1<br />
FEMALE<br />
MALE<br />
white HISPANIC BLACK ASIAN OTHER<br />
MAY <strong>2019</strong><br />
123