- Page 2 and 3:
Digital Signal Processing Using MAT
- Page 4 and 5:
Digital Signal Processing Using MAT
- Page 6 and 7:
Digital Signal Processing Using MAT
- Page 8 and 9:
Contents PREFACE xi 1 INTRODUCTION
- Page 10 and 11:
CONTENTS vii 6 IMPLEMENTATION OF DI
- Page 12 and 13:
CONTENTS ix 11.3 Suppression of Nar
- Page 14 and 15:
Preface From the beginning of the 1
- Page 16 and 17:
PREFACE xiii implementation. The di
- Page 18 and 19:
PREFACE xv ACKNOWLEDGMENTS We are i
- Page 20 and 21:
CHAPTER 1 Introduction During the p
- Page 22 and 23:
Overview of Digital Signal Processi
- Page 24 and 25:
A Brief Introduction to MATLAB 5 It
- Page 26 and 27:
A Brief Introduction to MATLAB 7 Va
- Page 28 and 29:
A Brief Introduction to MATLAB 9 us
- Page 30 and 31:
A Brief Introduction to MATLAB 11 o
- Page 32 and 33:
A Brief Introduction to MATLAB 13 o
- Page 34 and 35:
A Brief Introduction to MATLAB 15 T
- Page 36 and 37:
Applications of Digital Signal Proc
- Page 38 and 39:
Applications of Digital Signal Proc
- Page 40 and 41:
Brief Overview of the Book 21 In al
- Page 42 and 43:
Discrete-time Signals 23 In MATLAB
- Page 44 and 45:
Discrete-time Signals 25 For exampl
- Page 46 and 47:
Discrete-time Signals 27 n = min(mi
- Page 48 and 49:
Discrete-time Signals 29 Solution a
- Page 50 and 51:
Discrete-time Signals 31 Sequence i
- Page 52 and 53:
Discrete-time Signals 33 The quanti
- Page 54 and 55:
Discrete-time Signals 35 Rectangula
- Page 56 and 57:
Discrete Systems 37 In DSP we will
- Page 58 and 59:
Discrete Systems 39 every input seq
- Page 60 and 61:
Convolution 41 2 Input Sequence 1.5
- Page 62 and 63:
Convolution 43 x(k) and h(k) x(k) a
- Page 64 and 65:
Convolution 45 Hence y(n) ={6, 31,
- Page 66 and 67:
Difference Equations 47 Note that t
- Page 68 and 69:
Difference Equations 49 Solution Fr
- Page 70 and 71:
Difference Equations 51 8 Output Se
- Page 72 and 73:
Problems 53 IIR filter If the impul
- Page 74 and 75:
Problems 55 1. Modify the evenodd f
- Page 76 and 77:
Problems 57 2. x(n) ={1, 1, 0, 1, 1
- Page 78 and 79:
CHAPTER 3 The Discrete-time Fourier
- Page 80 and 81:
The Discrete-time Fourier Transform
- Page 82 and 83:
The Discrete-time Fourier Transform
- Page 84 and 85:
The Discrete-time Fourier Transform
- Page 86 and 87:
The Properties of the DTFT 67 TABLE
- Page 88 and 89:
The Properties of the DTFT 69 8. Mu
- Page 90 and 91:
The Properties of the DTFT 71 60 Ma
- Page 92 and 93:
The Properties of the DTFT 73 2 Rea
- Page 94 and 95:
The Frequency Domain Representation
- Page 96 and 97:
The Frequency Domain Representation
- Page 98 and 99:
The Frequency Domain Representation
- Page 100 and 101:
Sampling and Reconstruction of Anal
- Page 102 and 103:
Sampling and Reconstruction of Anal
- Page 104 and 105:
Sampling and Reconstruction of Anal
- Page 106 and 107:
Sampling and Reconstruction of Anal
- Page 108 and 109:
Sampling and Reconstruction of Anal
- Page 110 and 111:
Sampling and Reconstruction of Anal
- Page 112 and 113:
Sampling and Reconstruction of Anal
- Page 114 and 115:
Sampling and Reconstruction of Anal
- Page 116 and 117:
Problems 97 % check >> error = max(
- Page 118 and 119:
Problems 99 Remember that the above
- Page 120 and 121:
Problems 101 P3.16 Foralinear, shif
- Page 122 and 123:
CHAPTER 4 The z-Transform In Chapte
- Page 124 and 125:
The Bilateral z-Transform 105 Im{z}
- Page 126 and 127:
Important Properties of the z-Trans
- Page 128 and 129:
Important Properties of the z-Trans
- Page 130 and 131:
Important Properties of the z-Trans
- Page 132 and 133:
Inversion of the z-Transform 113 wh
- Page 134 and 135:
Inversion of the z-Transform 115 be
- Page 136 and 137:
Inversion of the z-Transform 117 He
- Page 138 and 139:
System Representation in the z-Doma
- Page 140 and 141:
System Representation in the z-Doma
- Page 142 and 143:
System Representation in the z-Doma
- Page 144 and 145:
System Representation in the z-Doma
- Page 146 and 147:
System Representation in the z-Doma
- Page 148 and 149:
Solutions of the Difference Equatio
- Page 150 and 151:
Solutions of the Difference Equatio
- Page 152 and 153:
Solutions of the Difference Equatio
- Page 154 and 155:
Problems 135 4. x(n) =n 2 (2/3) n
- Page 156 and 157:
Problems 137 2. Using (4.32), deter
- Page 158 and 159:
Problems 139 It is also known that
- Page 160 and 161:
CHAPTER 5 The Discrete Fourier Tran
- Page 162 and 163:
The Discrete Fourier Series 143 den
- Page 164 and 165:
The Discrete Fourier Series 145 The
- Page 166 and 167:
The Discrete Fourier Series 147 DFS
- Page 168 and 169:
Sampling and Reconstruction in the
- Page 170 and 171:
Sampling and Reconstruction in the
- Page 172 and 173:
Sampling and Reconstruction in the
- Page 174 and 175:
The Discrete Fourier Transform 155
- Page 176 and 177:
The Discrete Fourier Transform 157
- Page 178 and 179:
The Discrete Fourier Transform 159
- Page 180 and 181:
The Discrete Fourier Transform 161
- Page 182 and 183:
The Discrete Fourier Transform 163
- Page 184 and 185:
Properties of the Discrete Fourier
- Page 186 and 187:
Properties of the Discrete Fourier
- Page 188 and 189:
Properties of the Discrete Fourier
- Page 190 and 191:
Properties of the Discrete Fourier
- Page 192 and 193:
Properties of the Discrete Fourier
- Page 194 and 195:
Properties of the Discrete Fourier
- Page 196 and 197:
Properties of the Discrete Fourier
- Page 198 and 199:
Properties of the Discrete Fourier
- Page 200 and 201:
Linear Convolution Using the DFT 18
- Page 202 and 203:
Linear Convolution Using the DFT 18
- Page 204 and 205:
Linear Convolution Using the DFT 18
- Page 206 and 207:
The Fast Fourier Transform 187 5.6
- Page 208 and 209:
The Fast Fourier Transform 189 Usin
- Page 210 and 211:
The Fast Fourier Transform 191 and
- Page 212 and 213:
The Fast Fourier Transform 193 Fina
- Page 214 and 215:
The Fast Fourier Transform 195 Let
- Page 216 and 217:
The Fast Fourier Transform 197 N =2
- Page 218 and 219:
The Fast Fourier Transform 199 comp
- Page 220 and 221:
Problems 201 Clearly, ˜x 3(n) isdi
- Page 222 and 223:
Problems 203 determine the impulse
- Page 224 and 225:
Problems 205 and use this property.
- Page 226 and 227:
Problems 207 function x3 = circonvf
- Page 228 and 229:
Problems 209 where l is an integer.
- Page 230 and 231:
Problems 211 2. From the following
- Page 232 and 233:
Basic Elements 213 characteristics
- Page 234 and 235:
IIR Filter Structures 215 FIGURE 6.
- Page 236 and 237:
IIR Filter Structures 217 FIGURE 6.
- Page 238 and 239:
IIR Filter Structures 219 for i = 1
- Page 240 and 241:
IIR Filter Structures 221 6.2.6 PAR
- Page 242 and 243:
IIR Filter Structures 223 Brow = r(
- Page 244 and 245:
IIR Filter Structures 225 □ EXAMP
- Page 246 and 247:
IIR Filter Structures 227 a1 = 1.00
- Page 248 and 249:
FIR Filter Structures 229 FIGURE 6.
- Page 250 and 251: FIR Filter Structures 231 FIGURE 6.
- Page 252 and 253: FIR Filter Structures 233 FIGURE 6.
- Page 254 and 255: FIR Filter Structures 235 6.3.8 MAT
- Page 256 and 257: FIR Filter Structures 237 FIGURE 6.
- Page 258 and 259: Lattice Filter Structures 239 1.000
- Page 260 and 261: Lattice Filter Structures 241 There
- Page 262 and 263: Lattice Filter Structures 243 FIGUR
- Page 264 and 265: Lattice Filter Structures 245 FIGUR
- Page 266 and 267: Lattice Filter Structures 247 funct
- Page 268 and 269: Lattice Filter Structures 249 Solut
- Page 270 and 271: Representation of Numbers 251 new f
- Page 272 and 273: Representation of Numbers 253 rule
- Page 274 and 275: Representation of Numbers 255 Solut
- Page 276 and 277: Representation of Numbers 257 Ten
- Page 278 and 279: Representation of Numbers 259 negat
- Page 280 and 281: Representation of Numbers 261 Two
- Page 282 and 283: Representation of Numbers 263 For t
- Page 284 and 285: Representation of Numbers 265 IEEE
- Page 286 and 287: The Process of Quantization and Err
- Page 288 and 289: The Process of Quantization and Err
- Page 290 and 291: The Process of Quantization and Err
- Page 292 and 293: Quantization of Filter Coefficients
- Page 294 and 295: Quantization of Filter Coefficients
- Page 296 and 297: Quantization of Filter Coefficients
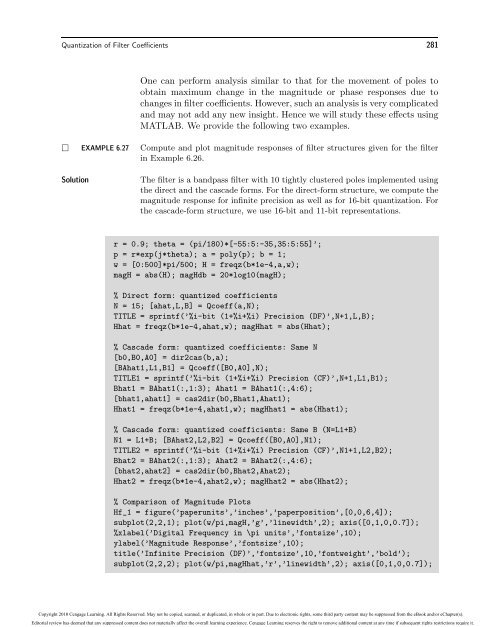
- Page 298 and 299: Quantization of Filter Coefficients
- Page 302 and 303: Quantization of Filter Coefficients
- Page 304 and 305: Quantization of Filter Coefficients
- Page 306 and 307: Quantization of Filter Coefficients
- Page 308 and 309: Problems 289 z −1 x(n) K 2 2 0.5
- Page 310 and 311: Problems 291 x(n) −1/2 1/2 −2/3
- Page 312 and 313: Problems 293 0.5 1 −1 z −1 2 1
- Page 314 and 315: Problems 295 1. Direct form 2. Line
- Page 316 and 317: Problems 297 P6.24 MATLAB provides
- Page 318 and 319: Problems 299 4. Explain why the mag
- Page 320 and 321: Problems 301 P6.38 An IIR bandstop
- Page 322 and 323: CHAPTER 7 FIR Filter Design We now
- Page 324 and 325: Preliminaries 305 1 + δ 1 1 1 −
- Page 326 and 327: Properties of Linear-phase FIR Filt
- Page 328 and 329: Properties of Linear-phase FIR Filt
- Page 330 and 331: Properties of Linear-phase FIR Filt
- Page 332 and 333: Properties of Linear-phase FIR Filt
- Page 334 and 335: Properties of Linear-phase FIR Filt
- Page 336 and 337: Properties of Linear-phase FIR Filt
- Page 338 and 339: Properties of Linear-phase FIR Filt
- Page 340 and 341: Properties of Linear-phase FIR Filt
- Page 342 and 343: Window Design Techniques 323 where
- Page 344 and 345: Window Design Techniques 325 Rectan
- Page 346 and 347: Window Design Techniques 327 of att
- Page 348 and 349: Window Design Techniques 329 Hammin
- Page 350 and 351:
Window Design Techniques 331 where
- Page 352 and 353:
Window Design Techniques 333 To dis
- Page 354 and 355:
Window Design Techniques 335 Ideal
- Page 356 and 357:
Window Design Techniques 337 Soluti
- Page 358 and 359:
Window Design Techniques 339 The id
- Page 360 and 361:
Window Design Techniques 341 □ EX
- Page 362 and 363:
Window Design Techniques 343 Ideal
- Page 364 and 365:
Frequency Sampling Design Technique
- Page 366 and 367:
Frequency Sampling Design Technique
- Page 368 and 369:
Frequency Sampling Design Technique
- Page 370 and 371:
Frequency Sampling Design Technique
- Page 372 and 373:
Frequency Sampling Design Technique
- Page 374 and 375:
Frequency Sampling Design Technique
- Page 376 and 377:
Frequency Sampling Design Technique
- Page 378 and 379:
Optimal Equiripple Design Technique
- Page 380 and 381:
Optimal Equiripple Design Technique
- Page 382 and 383:
Optimal Equiripple Design Technique
- Page 384 and 385:
Optimal Equiripple Design Technique
- Page 386 and 387:
Optimal Equiripple Design Technique
- Page 388 and 389:
Optimal Equiripple Design Technique
- Page 390 and 391:
Optimal Equiripple Design Technique
- Page 392 and 393:
Optimal Equiripple Design Technique
- Page 394 and 395:
Problems 375 h(n) 0.8 0.6 0.4 0.2 0
- Page 396 and 397:
Problems 377 where coefficients ˜c
- Page 398 and 399:
Problems 379 Plot the impulse respo
- Page 400 and 401:
Problems 381 2.02 1.98 Hr(ω) 1 0 0
- Page 402 and 403:
Problems 383 P7.34 Design a minimum
- Page 404 and 405:
Problems 385 P7.38 Design a minimum
- Page 406 and 407:
Some Preliminaries 387 8.1 SOME PRE
- Page 408 and 409:
Some Preliminaries 389 8.1.2 PROPER
- Page 410 and 411:
Some Special Filter Types 391 The c
- Page 412 and 413:
Some Special Filter Types 393 Magni
- Page 414 and 415:
Some Special Filter Types 395 Imagi
- Page 416 and 417:
Some Special Filter Types 397 (a) F
- Page 418 and 419:
Some Special Filter Types 399 circl
- Page 420 and 421:
Characteristics of Prototype Analog
- Page 422 and 423:
Characteristics of Prototype Analog
- Page 424 and 425:
Characteristics of Prototype Analog
- Page 426 and 427:
Characteristics of Prototype Analog
- Page 428 and 429:
Characteristics of Prototype Analog
- Page 430 and 431:
Characteristics of Prototype Analog
- Page 432 and 433:
Characteristics of Prototype Analog
- Page 434 and 435:
Characteristics of Prototype Analog
- Page 436 and 437:
Characteristics of Prototype Analog
- Page 438 and 439:
Characteristics of Prototype Analog
- Page 440 and 441:
Characteristics of Prototype Analog
- Page 442 and 443:
Analog-to-Digital Filter Transforma
- Page 444 and 445:
Analog-to-Digital Filter Transforma
- Page 446 and 447:
Analog-to-Digital Filter Transforma
- Page 448 and 449:
Analog-to-Digital Filter Transforma
- Page 450 and 451:
Analog-to-Digital Filter Transforma
- Page 452 and 453:
Analog-to-Digital Filter Transforma
- Page 454 and 455:
Analog-to-Digital Filter Transforma
- Page 456 and 457:
Analog-to-Digital Filter Transforma
- Page 458 and 459:
Analog-to-Digital Filter Transforma
- Page 460 and 461:
Analog-to-Digital Filter Transforma
- Page 462 and 463:
Lowpass Filter Design Using MATLAB
- Page 464 and 465:
Lowpass Filter Design Using MATLAB
- Page 466 and 467:
Lowpass Filter Design Using MATLAB
- Page 468 and 469:
Frequency-band Transformations 449
- Page 470 and 471:
Frequency-band Transformations 451
- Page 472 and 473:
Frequency-band Transformations 453
- Page 474 and 475:
Frequency-band Transformations 455
- Page 476 and 477:
Frequency-band Transformations 457
- Page 478 and 479:
Frequency-band Transformations 459
- Page 480 and 481:
Problems 461 1 0.8913 Magnitude Res
- Page 482 and 483:
Problems 463 1. Determine the value
- Page 484 and 485:
Problems 465 function [b,a] =afd(ty
- Page 486 and 487:
Problems 467 function [b,a] = mzt(c
- Page 488 and 489:
Problems 469 P8.35 Design a highpas
- Page 490 and 491:
Problems 471 Using this function, d
- Page 492 and 493:
Problems 473 1 0.9 Equiripple |H (e
- Page 494 and 495:
Introduction 475 x a (t) ADC F s =
- Page 496 and 497:
Decimation by a Factor D 477 as h(n
- Page 498 and 499:
Decimation by a Factor D 479 given
- Page 500 and 501:
Decimation by a Factor D 481 |X(ω
- Page 502 and 503:
Decimation by a Factor D 483 The ou
- Page 504 and 505:
Decimation by a Factor D 485 % (c)
- Page 506 and 507:
Interpolation by a Factor I 487 Sol
- Page 508 and 509:
Interpolation by a Factor I 489 Ide
- Page 510 and 511:
Interpolation by a Factor I 491 % (
- Page 512 and 513:
Sampling Rate Conversion by a Ratio
- Page 514 and 515:
Sampling Rate Conversion by a Ratio
- Page 516 and 517:
Sampling Rate Conversion by a Ratio
- Page 518 and 519:
FIR Filter Designs for Sampling Rat
- Page 520 and 521:
FIR Filter Designs for Sampling Rat
- Page 522 and 523:
FIR Filter Designs for Sampling Rat
- Page 524 and 525:
FIR Filter Designs for Sampling Rat
- Page 526 and 527:
FIR Filter Designs for Sampling Rat
- Page 528 and 529:
FIR Filter Designs for Sampling Rat
- Page 530 and 531:
FIR Filter Designs for Sampling Rat
- Page 532 and 533:
FIR Filter Designs for Sampling Rat
- Page 534 and 535:
FIR Filter Designs for Sampling Rat
- Page 536 and 537:
FIR Filter Designs for Sampling Rat
- Page 538 and 539:
FIR Filter Designs for Sampling Rat
- Page 540 and 541:
FIR Filter Structures for Sampling
- Page 542 and 543:
FIR Filter Structures for Sampling
- Page 544 and 545:
FIR Filter Structures for Sampling
- Page 546 and 547:
FIR Filter Structures for Sampling
- Page 548 and 549:
FIR Filter Structures for Sampling
- Page 550 and 551:
Problems 531 P9.3 Consider a signal
- Page 552 and 553:
Problems 533 1. Compute and plot th
- Page 554 and 555:
Problems 535 3. Let x(n) =cos(0.3π
- Page 556 and 557:
Problems 537 3. Using the fir2 func
- Page 558 and 559:
Analysis of A/D Quantization Noise
- Page 560 and 561:
Analysis of A/D Quantization Noise
- Page 562 and 563:
Analysis of A/D Quantization Noise
- Page 564 and 565:
Analysis of A/D Quantization Noise
- Page 566 and 567:
Analysis of A/D Quantization Noise
- Page 568 and 569:
Analysis of A/D Quantization Noise
- Page 570 and 571:
Round-off Effects in IIR Digital Fi
- Page 572 and 573:
Round-off Effects in IIR Digital Fi
- Page 574 and 575:
Round-off Effects in IIR Digital Fi
- Page 576 and 577:
Round-off Effects in IIR Digital Fi
- Page 578 and 579:
Round-off Effects in IIR Digital Fi
- Page 580 and 581:
Round-off Effects in IIR Digital Fi
- Page 582 and 583:
Round-off Effects in IIR Digital Fi
- Page 584 and 585:
Round-off Effects in IIR Digital Fi
- Page 586 and 587:
Round-off Effects in IIR Digital Fi
- Page 588 and 589:
Round-off Effects in IIR Digital Fi
- Page 590 and 591:
Round-off Effects in IIR Digital Fi
- Page 592 and 593:
Round-off Effects in IIR Digital Fi
- Page 594 and 595:
Round-off Effects in IIR Digital Fi
- Page 596 and 597:
Round-off Effects in IIR Digital Fi
- Page 598 and 599:
Round-off Effects in FIR Digital Fi
- Page 600 and 601:
Round-off Effects in FIR Digital Fi
- Page 602 and 603:
Round-off Effects in FIR Digital Fi
- Page 604 and 605:
Round-off Effects in FIR Digital Fi
- Page 606 and 607:
Round-off Effects in FIR Digital Fi
- Page 608 and 609:
Round-off Effects in FIR Digital Fi
- Page 610 and 611:
Problems 591 P10.6 Consider the 1st
- Page 612 and 613:
Problems 593 which is implemented i
- Page 614 and 615:
Applications in Adaptive Filtering
- Page 616 and 617:
LMS Algorithm for Coefficient Adjus
- Page 618 and 619:
System Identification or System Mod
- Page 620 and 621:
Suppression of Narrowband Interfere
- Page 622 and 623:
Adaptive Channel Equalization 603 T
- Page 624 and 625:
Adaptive Channel Equalization 605 F
- Page 626 and 627:
CHAPTER 12 Applications in Communic
- Page 628 and 629:
Pulse-Code Modulation 609 called a
- Page 630 and 631:
Differential PCM (DPCM) 611 the sig
- Page 632 and 633:
Differential PCM (DPCM) 613 digits
- Page 634 and 635:
Adaptive PCM and DPCM (ADPCM) 615 a
- Page 636 and 637:
Adaptive PCM and DPCM (ADPCM) 617 F
- Page 638 and 639:
Delta Modulation (DM) 619 FIGURE 12
- Page 640 and 641:
Delta Modulation (DM) 621 FIGURE 12
- Page 642 and 643:
Linear Predictive Coding (LPC) of S
- Page 644 and 645:
Linear Predictive Coding (LPC) of S
- Page 646 and 647:
Dual-tone Multifrequency (DTMF) Sig
- Page 648 and 649:
Dual-tone Multifrequency (DTMF) Sig
- Page 650 and 651:
Binary Digital Communications 631 F
- Page 652 and 653:
Spread-Spectrum Communications 633
- Page 654 and 655:
BIBLIOGRAPHY [1] J. W. Cooley and J
- Page 656 and 657:
INDEX ’operator, 25 &operator, 26
- Page 658 and 659:
INDEX 639 adaptive delta modulation
- Page 660 and 661:
INDEX 641 finite-precision numerica
- Page 662 and 663:
INDEX 643 round-off effects, 580-59
- Page 664 and 665:
INDEX 645 DTFT formula, 152-153 err
- Page 666 and 667:
INDEX 647 optimal equiripple design
- Page 668 and 669:
INDEX 649 Real-valued exponential s
- Page 670 and 671:
INDEX 651 Sinusoidal signals, 83-84