CPT International 4/2019

Create successful ePaper yourself
Turn your PDF publications into a flip-book with our unique Google optimized e-Paper software.
MELTING SHOP<br />
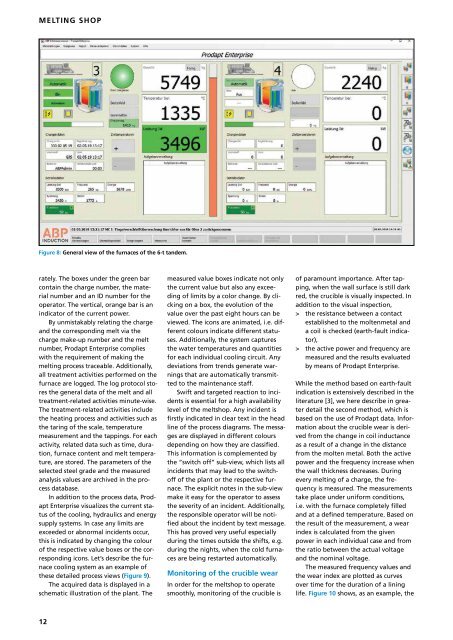
Figure 8: General view of the furnaces of the 6-t tandem.<br />
rately. The boxes under the green bar<br />
contain the charge number, the material<br />
number and an ID number for the<br />
operator. The vertical, orange bar is an<br />
indicator of the current power.<br />
By unmistakably relating the charge<br />
and the corresponding melt via the<br />
charge make-up number and the melt<br />
number, Prodapt Enterprise complies<br />
with the requirement of making the<br />
melting process traceable. Additionally,<br />
all treatment activities performed on the<br />
furnace are logged. The log protocol stores<br />
the general data of the melt and all<br />
treatment-related activities minute-wise.<br />
The treatment-related activities include<br />
the heating process and activities such as<br />
the taring of the scale, temperature<br />
measurement and the tappings. For each<br />
activity, related data such as time, duration,<br />
furnace content and melt temperature,<br />
are stored. The parameters of the<br />
selected steel grade and the measured<br />
analysis values are archived in the process<br />
database.<br />
In addition to the process data, Prodapt<br />
Enterprise visualizes the current status<br />
of the cooling, hydraulics and energy<br />
supply systems. In case any limits are<br />
exceeded or abnormal incidents occur,<br />
this is indicated by changing the colour<br />
of the respective value boxes or the corresponding<br />
icons. Let’s describe the furnace<br />
cooling system as an example of<br />
these detailed process views (Figure 9).<br />
The acquired data is displayed in a<br />
schematic illustration of the plant. The<br />
measured value boxes indicate not only<br />
the current value but also any exceeding<br />
of limits by a color change. By clicking<br />
on a box, the evolution of the<br />
value over the past eight hours can be<br />
viewed. The icons are animated, i.e. different<br />
colours indicate different statuses.<br />
Additionally, the system captures<br />
the water temperatures and quantities<br />
for each individual cooling circuit. Any<br />
deviations from trends generate warnings<br />
that are automatically transmitted<br />
to the maintenance staff.<br />
Swift and targeted reaction to incidents<br />
is essential for a high availability<br />
level of the meltshop. Any incident is<br />
firstly indicated in clear text in the head<br />
line of the process diagrams. The messages<br />
are displayed in different colours<br />
depending on how they are classified.<br />
This information is complemented by<br />
the “switch off” sub-view, which lists all<br />
incidents that may lead to the switchoff<br />
of the plant or the respective furnace.<br />
The explicit notes in the sub-view<br />
make it easy for the operator to assess<br />
the severity of an incident. Additionally,<br />
the responsible operator will be notified<br />
about the incident by text message.<br />
This has proved very useful especially<br />
during the times outside the shifts, e.g.<br />
during the nights, when the cold furnaces<br />
are being restarted automatically.<br />
Monitoring of the crucible wear<br />
In order for the meltshop to operate<br />
smoothly, monitoring of the crucible is<br />
of paramount importance. After tapping,<br />
when the wall surface is still dark<br />
red, the crucible is visually inspected. In<br />
addition to the visual inspection,<br />
> the resistance between a contact<br />
established to the moltenmetal and<br />
a coil is checked (earth-fault indicator),<br />
> the active power and frequency are<br />
measured and the results evaluated<br />
by means of Prodapt Enterprise.<br />
While the method based on earth-fault<br />
indication is extensively described in the<br />
literature [3], we here describe in greater<br />
detail the second method, which is<br />
based on the use of Prodapt data. Information<br />
about the crucible wear is derived<br />
from the change in coil inductance<br />
as a result of a change in the distance<br />
from the molten metal. Both the active<br />
power and the frequency increase when<br />
the wall thickness decreases. During<br />
every melting of a charge, the frequency<br />
is measured. The measurements<br />
take place under uniform conditions,<br />
i.e. with the furnace completely filled<br />
and at a defined temperature. Based on<br />
the result of the measurement, a wear<br />
index is calculated from the given<br />
power in each individual case and from<br />
the ratio between the actual voltage<br />
and the nominal voltage.<br />
The measured frequency values and<br />
the wear index are plotted as curves<br />
over time for the duration of a lining<br />
life. Figure 10 shows, as an example, the<br />
12