CPT International 4/2019

You also want an ePaper? Increase the reach of your titles
YUMPU automatically turns print PDFs into web optimized ePapers that Google loves.
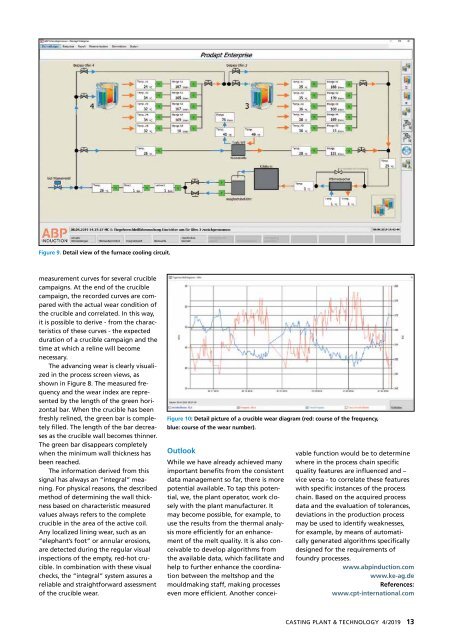
Figure 9. Detail view of the furnace cooling circuit.<br />
measurement curves for several crucible<br />
campaigns. At the end of the crucible<br />
campaign, the recorded curves are compared<br />
with the actual wear condition of<br />
the crucible and correlated. In this way,<br />
it is possible to derive - from the characteristics<br />
of these curves - the expected<br />
duration of a crucible campaign and the<br />
time at which a reline will become<br />
necessary.<br />
The advancing wear is clearly visualized<br />
in the process screen views, as<br />
shown in Figure 8. The measured frequency<br />
and the wear index are represented<br />
by the length of the green horizontal<br />
bar. When the crucible has been<br />
freshly relined, the green bar is completely<br />
filled. The length of the bar decreases<br />
as the crucible wall becomes thinner.<br />
The green bar disappears completely<br />
when the minimum wall thickness has<br />
been reached.<br />
The information derived from this<br />
signal has always an “integral” meaning.<br />
For physical reasons, the described<br />
method of determining the wall thickness<br />
based on characteristic measured<br />
values always refers to the complete<br />
crucible in the area of the active coil.<br />
Any localized lining wear, such as an<br />
“elephant’s foot” or annular erosions,<br />
are detected during the regular visual<br />
inspections of the empty, red-hot crucible.<br />
In combination with these visual<br />
checks, the “integral” system assures a<br />
reliable and straightforward assessment<br />
of the crucible wear.<br />
Figure 10: Detail picture of a crucible wear diagram (red: course of the frequency,<br />
blue: course of the wear number).<br />
Outlook<br />
While we have already achieved many<br />
important benefits from the consistent<br />
data management so far, there is more<br />
potential available. To tap this potential,<br />
we, the plant operator, work closely<br />
with the plant manufacturer. It<br />
may become possible, for example, to<br />
use the results from the thermal analysis<br />
more efficiently for an enhancement<br />
of the melt quality. It is also conceivable<br />
to develop algorithms from<br />
the available data, which facilitate and<br />
help to further enhance the coordination<br />
between the meltshop and the<br />
mouldmaking staff, making processes<br />
even more efficient. Another conceivable<br />
function would be to determine<br />
where in the process chain specific<br />
quality features are influenced and –<br />
vice versa - to correlate these features<br />
with specific instances of the process<br />
chain. Based on the acquired process<br />
data and the evaluation of tolerances,<br />
deviations in the production process<br />
may be used to identify weaknesses,<br />
for example, by means of automatically<br />
generated algorithms specifically<br />
designed for the requirements of<br />
foundry processes.<br />
www.abpinduction.com<br />
www.ke-ag.de<br />
References:<br />
www.cpt-international.com<br />
CASTING PLANT & TECHNOLOGY 4/<strong>2019</strong> 13