

Etude par Sonde Atomique Tomographique de la formation de nano ...
Etude par Sonde Atomique Tomographique de la formation de nano ...
Etude par Sonde Atomique Tomographique de la formation de nano ...

Create successful ePaper yourself
Turn your PDF publications into a flip-book with our unique Google optimized e-Paper software.
tel-00751814, version 1 - 14 Nov 2012<br />
Concentration Concentration (at,%) (at,%)<br />
100<br />
90<br />
80<br />
70<br />
60<br />
50<br />
40<br />
30<br />
20<br />
10<br />
0<br />
λ<br />
λ λFe+Cr Fe<br />
Chapter 3. Oxi<strong>de</strong> Dispersion Strengthened Steels<br />
λY-Ti-O λ YTiO<br />
Fe-Cr phase Y-Ti-O phase<br />
0 5 10 15 20 25 30 35 40 45 50 55 60<br />
Distance (at,%)<br />
Figure 3.2. Profile generated from a volume in Figure 3.1 (b). Characteristic lengths<br />
of Y-Ti-O – λY-Ti-O and Fe-Cr-rich phases and Fe-rich phases – λFe+Сr are shown. Fe, Cr, Mn,<br />
Si, C, W species are associated with Fe-Cr-rich phase while Y, YO, O/O2, Ti, TiOx, FeO,<br />
CrOx with Y-Ti-O phase. Profile is 12×12×60 nm 3 with step of 0.2 nm.<br />
A simi<strong>la</strong>r two-phase microstructure was also observed in a different analysis (LATAP<br />
analyse, see Figure 3.6) while a one phase structure, corresponding to Fe-Cr-rich phase has<br />
been observed in the <strong>la</strong>st experiment, Figure 3.3. This non homogeneous microstructure can<br />
be exp<strong>la</strong>ined simply looking at the microstructure observed during APT tip pre<strong>par</strong>ation in<br />
SEM / FIB (Figure 3.4). Different contrasts (bright and dark) clearly reveal that a two phase<br />
structure is present. The shape of both phases is not well <strong>de</strong>fined and irregu<strong>la</strong>r. From SEM<br />
picture it is clear that, the dimensions of these phases vary between tens of <strong>nano</strong>metres to<br />
several micrometers. So, the dimensions of these phases, can exp<strong>la</strong>in the different<br />
microstructures observed by 3DAP.<br />
Fe<br />
Cr<br />
W<br />
10×10×70 nm 3<br />
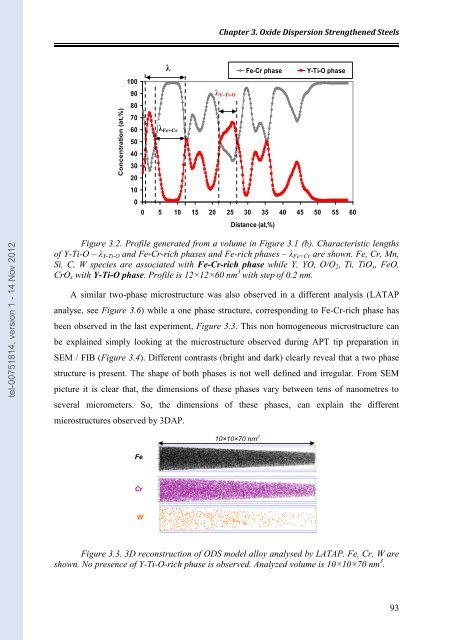
Figure 3.3. 3D reconstruction of ODS mo<strong>de</strong>l alloy analysed by LATAP. Fe, Cr, W are<br />
shown. No presence of Y-Ti-O-rich phase is observed. Analyzed volume is 10×10×70 nm 3 .<br />
93


