

Etude par Sonde Atomique Tomographique de la formation de nano ...
Etude par Sonde Atomique Tomographique de la formation de nano ...
Etude par Sonde Atomique Tomographique de la formation de nano ...

Create successful ePaper yourself
Turn your PDF publications into a flip-book with our unique Google optimized e-Paper software.
tel-00751814, version 1 - 14 Nov 2012<br />
Chapter 3. Oxi<strong>de</strong> Dispersion Strengthened Steels<br />
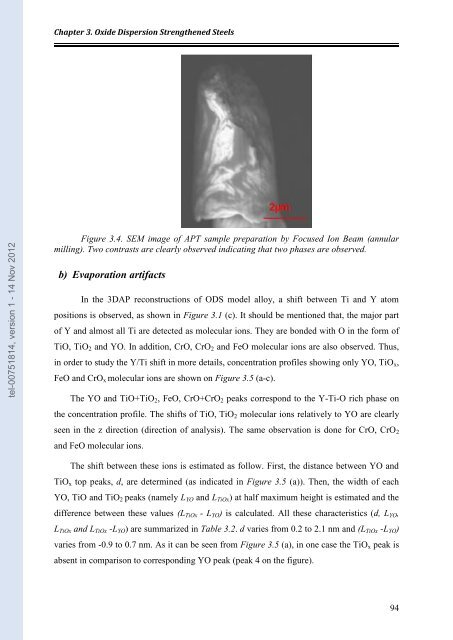
Figure 3.4. SEM image of APT sample pre<strong>par</strong>ation by Focused Ion Beam (annu<strong>la</strong>r<br />
milling). Two contrasts are clearly observed indicating that two phases are observed.<br />
b) Evaporation artifacts<br />
In the 3DAP reconstructions of ODS mo<strong>de</strong>l alloy, a shift between Ti and Y atom<br />
positions is observed, as shown in Figure 3.1 (c). It should be mentioned that, the major <strong>par</strong>t<br />
of Y and almost all Ti are <strong>de</strong>tected as molecu<strong>la</strong>r ions. They are bon<strong>de</strong>d with O in the form of<br />
TiO, TiO2 and YO. In addition, CrO, CrO2 and FeO molecu<strong>la</strong>r ions are also observed. Thus,<br />
in or<strong>de</strong>r to study the Y/Ti shift in more <strong>de</strong>tails, concentration profiles showing only YO, TiOx,<br />
FeO and CrOx molecu<strong>la</strong>r ions are shown on Figure 3.5 (a-c).<br />
The YO and TiO+TiO2, FeO, CrO+CrO2 peaks correspond to the Y-Ti-O rich phase on<br />
the concentration profile. The shifts of TiO, TiO2 molecu<strong>la</strong>r ions re<strong>la</strong>tively to YO are clearly<br />
seen in the z direction (direction of analysis). The same observation is done for CrO, CrO2<br />
and FeO molecu<strong>la</strong>r ions.<br />
The shift between these ions is estimated as follow. First, the distance between YO and<br />
TiOx top peaks, d, are <strong>de</strong>termined (as indicated in Figure 3.5 (a)). Then, the width of each<br />
YO, TiO and TiO2 peaks (namely LYO and LTiOx) at half maximum height is estimated and the<br />
difference between these values (LTiOx - LYO) is calcu<strong>la</strong>ted. All these characteristics (d, LYO,<br />
LTiOx and LTiOx -LYO) are summarized in Table 3.2. d varies from 0.2 to 2.1 nm and (LTiOx -LYO)<br />
varies from -0.9 to 0.7 nm. As it can be seen from Figure 3.5 (a), in one case the TiOx peak is<br />
absent in com<strong>par</strong>ison to corresponding YO peak (peak 4 on the figure).<br />
94


