

Etude par Sonde Atomique Tomographique de la formation de nano ...
Etude par Sonde Atomique Tomographique de la formation de nano ...
Etude par Sonde Atomique Tomographique de la formation de nano ...

You also want an ePaper? Increase the reach of your titles
YUMPU automatically turns print PDFs into web optimized ePapers that Google loves.
tel-00751814, version 1 - 14 Nov 2012<br />
Chapter 3. Oxi<strong>de</strong> Dispersion Strengthened Steels<br />
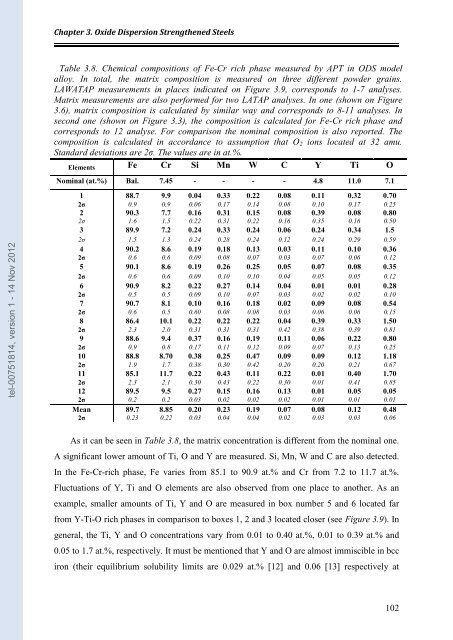
Table 3.8. Chemical compositions of Fe-Cr rich phase measured by APT in ODS mo<strong>de</strong>l<br />
alloy. In total, the matrix composition is measured on three different pow<strong>de</strong>r grains.<br />
LAWATAP measurements in p<strong>la</strong>ces indicated on Figure 3.9, corresponds to 1-7 analyses.<br />
Matrix measurements are also performed for two LATAP analyses. In one (shown on Figure<br />
3.6), matrix composition is calcu<strong>la</strong>ted by simi<strong>la</strong>r way and corresponds to 8-11 analyses. In<br />
second one (shown on Figure 3.3), the composition is calcu<strong>la</strong>ted for Fe-Cr rich phase and<br />
corresponds to 12 analyse. For com<strong>par</strong>ison the nominal composition is also reported. The<br />
composition is calcu<strong>la</strong>ted in accordance to assumption that O2 ions located at 32 amu.<br />
Standard <strong>de</strong>viations are 2σ. The values are in at.%.<br />
Elements Fe Cr Si Mn W C Y Ti O<br />
Nominal (at.%) Bal. 7.45 - - - - 4.8 11.0 7.1<br />
1 88.7 9.9 0.04 0.33 0.22 0.08 0.11 0.32 0.70<br />
2σ 0.9 0.9 0.06 0.17 0.14 0.08 0.10 0.17 0.25<br />
2 90.3 7.7 0.16 0.31 0.15 0.08 0.39 0.08 0.80<br />
2σ 1.6 1.5 0.22 0.31 0.22 0.16 0.35 0.16 0.50<br />
3 89.9 7.2 0.24 0.33 0.24 0.06 0.24 0.34 1.5<br />
2σ 1.5 1.3 0.24 0.28 0.24 0.12 0.24 0.29 0.59<br />
4 90.2 8.6 0.19 0.18 0.13 0.03 0.11 0.10 0.36<br />
2σ 0.6 0.6 0.09 0.08 0.07 0.03 0.07 0.06 0.12<br />
5 90.1 8.6 0.19 0.26 0.25 0.05 0.07 0.08 0.35<br />
2σ 0.6 0.6 0.09 0.10 0.10 0.04 0.05 0.05 0.12<br />
6 90.9 8.2 0.22 0.27 0.14 0.04 0.01 0.01 0.28<br />
2σ 0.5 0.5 0.09 0.10 0.07 0.03 0.02 0.02 0.10<br />
7 90.7 8.1 0.10 0.16 0.18 0.02 0.09 0.08 0.54<br />
2σ 0.6 0.5 0.60 0.08 0.08 0.03 0.06 0.06 0.15<br />
8 86.4 10.1 0.22 0.22 0.22 0.04 0.39 0.33 1.50<br />
2σ 2.3 2.0 0.31 0.31 0.31 0.42 0.38 0.39 0.81<br />
9 88.6 9.4 0.37 0.16 0.19 0.11 0.06 0.22 0.80<br />
2σ 0.9 0.8 0.17 0.11 0.12 0.09 0.07 0.13 0.25<br />
10 88.8 8.70 0.38 0.25 0.47 0.09 0.09 0.12 1.18<br />
2σ 1.9 1.7 0.38 0.30 0.42 0.20 0.20 0.21 0.67<br />
11 85.1 11.7 0.22 0.43 0.11 0.22 0.01 0.40 1.70<br />
2σ 2.3 2.1 0.30 0.43 0.22 0.30 0.01 0.41 0.85<br />
12 89.5 9.5 0.27 0.15 0.16 0.13 0.01 0.05 0.05<br />
2σ 0.2 0.2 0.03 0.02 0.02 0.02 0.01 0.01 0.01<br />
Mean 89.7 8.85 0.20 0.23 0.19 0.07 0.08 0.12 0.48<br />
2σ 0.23 0.22 0.03 0.04 0.04 0.02 0.03 0.03 0.06<br />
As it can be seen in Table 3.8, the matrix concentration is different from the nominal one.<br />
A significant lower amount of Ti, O and Y are measured. Si, Mn, W and C are also <strong>de</strong>tected.<br />
In the Fe-Cr-rich phase, Fe varies from 85.1 to 90.9 at.% and Cr from 7.2 to 11.7 at.%.<br />
Fluctuations of Y, Ti and O elements are also observed from one p<strong>la</strong>ce to another. As an<br />
example, smaller amounts of Ti, Y and O are measured in box number 5 and 6 located far<br />
from Y-Ti-O rich phases in com<strong>par</strong>ison to boxes 1, 2 and 3 located closer (see Figure 3.9). In<br />
general, the Ti, Y and O concentrations vary from 0.01 to 0.40 at.%, 0.01 to 0.39 at.% and<br />
0.05 to 1.7 at.%, respectively. It must be mentioned that Y and O are almost immiscible in bcc<br />
iron (their equilibrium solubility limits are 0.029 at.% [12] and 0.06 [13] respectively at<br />
102


