STUDENT EVALUATION OF CLINICAL EDUCATION ENVIRONMENT
STUDENT EVALUATION OF CLINICAL EDUCATION ENVIRONMENT
STUDENT EVALUATION OF CLINICAL EDUCATION ENVIRONMENT

Create successful ePaper yourself
Turn your PDF publications into a flip-book with our unique Google optimized e-Paper software.
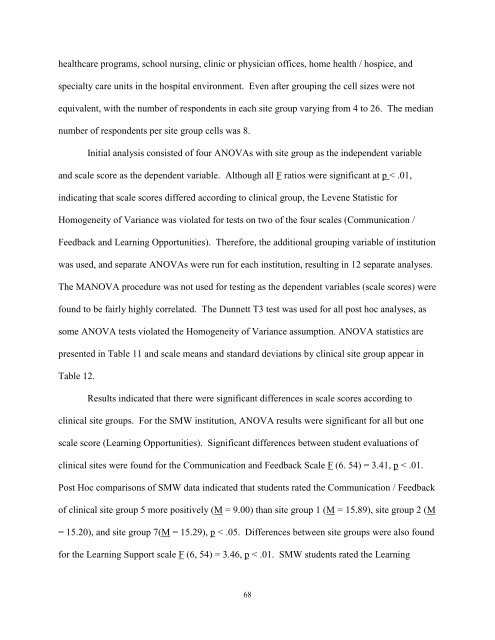
healthcare programs, school nursing, clinic or physician offices, home health / hospice, and<br />
specialty care units in the hospital environment. Even after grouping the cell sizes were not<br />
equivalent, with the number of respondents in each site group varying from 4 to 26. The median<br />
number of respondents per site group cells was 8.<br />
Initial analysis consisted of four ANOVAs with site group as the independent variable<br />
and scale score as the dependent variable. Although all F ratios were significant at p < .01,<br />
indicating that scale scores differed according to clinical group, the Levene Statistic for<br />
Homogeneity of Variance was violated for tests on two of the four scales (Communication /<br />
Feedback and Learning Opportunities). Therefore, the additional grouping variable of institution<br />
was used, and separate ANOVAs were run for each institution, resulting in 12 separate analyses.<br />
The MANOVA procedure was not used for testing as the dependent variables (scale scores) were<br />
found to be fairly highly correlated. The Dunnett T3 test was used for all post hoc analyses, as<br />
some ANOVA tests violated the Homogeneity of Variance assumption. ANOVA statistics are<br />
presented in Table 11 and scale means and standard deviations by clinical site group appear in<br />
Table 12.<br />
Results indicated that there were significant differences in scale scores according to<br />
clinical site groups. For the SMW institution, ANOVA results were significant for all but one<br />
scale score (Learning Opportunities). Significant differences between student evaluations of<br />
clinical sites were found for the Communication and Feedback Scale F (6. 54) = 3.41, p < .01.<br />
Post Hoc comparisons of SMW data indicated that students rated the Communication / Feedback<br />
of clinical site group 5 more positively (M = 9.00) than site group 1 (M = 15.89), site group 2 (M<br />
= 15.20), and site group 7(M = 15.29), p < .05. Differences between site groups were also found<br />
for the Learning Support scale F (6, 54) = 3.46, p < .01. SMW students rated the Learning<br />
68