- Page 1 and 2: Final Report, 2005-2010 and Annual
- Page 3 and 4: 6. Appendix - Final Reports .......
- Page 5 and 6: • Spring 2008: Representation The
- Page 7 and 8: place the highest value on the oppo
- Page 9 and 10: which establishes the relation betw
- Page 11 and 12: Public Understanding of Mathematics
- Page 14 and 15: 1.3 Scientific Programs and their A
- Page 16 and 17: The first week of May 2010 coincide
- Page 18 and 19: The goal of this program was, throu
- Page 20 and 21: "An illustration of the tropical Ab
- Page 22 and 23: • lead to new breakthroughs in th
- Page 24 and 25: Other mathematical breakthroughs th
- Page 26 and 27: • Advice on preparing for intervi
- Page 28 and 29: An off-site workshop partially fund
- Page 30 and 31: 1.7 Other Scientific Workshops Hot
- Page 32 and 33: experienced circle leaders. Togethe
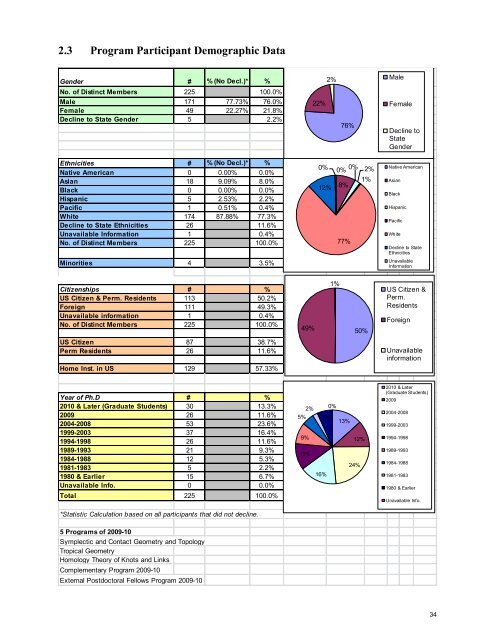
- Page 34 and 35: 2. Program and Workshop Data 2.1 Pr
- Page 36 and 37: Jöricke Burglind Institut des Haut
- Page 40 and 41: Home Institution Classified by Stat
- Page 42 and 43: 2.4 Workshop Participant List (See
- Page 44 and 45: Home Institution Classified by Stat
- Page 46 and 47: 2.7 Program Publication List Last N
- Page 48 and 49: Ghiggini Paolo Sutures and contact
- Page 50 and 51: Lekili Yanki Geometric composition
- Page 52 and 53: Draisma Jan The tropical projective
- Page 54 and 55: Krasner Daniel Patterns in sl(2)-li
- Page 56 and 57: Sarkar Sucharit Murasugi sums Matt
- Page 58 and 59: Falk Michael Feichtner Eva Tropical
- Page 60 and 61: Manolescu Ciprian Manolescu Ciprian
- Page 62 and 63: Steingrimsson Einar Steingrimsson E
- Page 64 and 65: Here are additional details on the
- Page 66 and 67: Kutluhan, Cagatay Lekili, Yanki Cag
- Page 68 and 69: Savelyev, Yakov Vertesi, Vera Yakov
- Page 70 and 71: Katz, Eric Lopez de Medrano, Lucia
- Page 72 and 73: Grigsby, Elisenda Kutluhan, Cagatay
- Page 74 and 75: Sazdanovic, Radmila Wehrli, Stephan
- Page 76 and 77: Angeltveit, Vigleik Crofts, Scott H
- Page 78 and 79: 3.2 Postdoctoral Fellow Placement L
- Page 80 and 81: 3.4 Postdoctoral Fellow Demographic
- Page 82 and 83: Home Institution Classified by Coun
- Page 84 and 85: SGS 1: IAS/PCMI Summer Workshop: Th
- Page 86 and 87: Jafarov, Elchin University of Alask
- Page 88 and 89:
Xie, Yu Purdue University Graduate
- Page 90 and 91:
Home Institution Classified by Stat
- Page 92 and 93:
4.3 Program Associates Program Asso
- Page 94 and 95:
P r o g r a m A s s o c i a t e s D
- Page 96 and 97:
Home Institution Classified by Coun
- Page 98 and 99:
5. Undergraduate Program (MSRI-UP)
- Page 100 and 101:
This project seeks to use elliptic
- Page 102 and 103:
6. Appendix - Final Reports 97
- Page 104 and 105:
2 2. Participants The response to o
- Page 106 and 107:
4 • Gleb Koshevoy: Bases of tropi
- Page 108 and 109:
6 While at MSRI, Gathmann extended
- Page 110 and 111:
8 In conclusion, my postdoc at MSRI
- Page 112 and 113:
10 -with Christian Haase, who staye
- Page 114 and 115:
12 “I was working on the relation
- Page 116 and 117:
14 Josephine Yu PhD: UC Berkeley, 2
- Page 118 and 119:
16 6. Alex Fink was an invited spea
- Page 120 and 121:
Tropical Geometry Postdoctoral Fell
- Page 122 and 123:
Tropical Geometry Demographic Summa
- Page 124 and 125:
Ozsváth-Szabó Heegaard homology t
- Page 126 and 127:
field. Nevertheless, some of it is
- Page 128 and 129:
developments which occurred in this
- Page 130 and 131:
the audience would know a little ab
- Page 132 and 133:
on the group of Hamiltonian diffeom
- Page 134 and 135:
German Research Foundation Mentor:
- Page 136 and 137:
Mark spend his time at MSRI working
- Page 138 and 139:
PhD: University of Texas, 2007 Posi
- Page 140 and 141:
example Gadbled, Mandini, Ma’u, H
- Page 142 and 143:
Symplectic and Contact Geometry and
- Page 144 and 145:
Symplectic and Contact Geometry and
- Page 146 and 147:
2 REPORT ON THE MSRI WORKSHOP “HO
- Page 148 and 149:
4 REPORT ON THE MSRI WORKSHOP “HO
- Page 150 and 151:
6 REPORT ON THE MSRI WORKSHOP “HO
- Page 152 and 153:
Homology Theory of Knots and Links
- Page 154 and 155:
Complementary Program August 17, 20
- Page 156 and 157:
Complementary Program 2009-10 Postd
- Page 158 and 159:
Complementary Program Demographic S
- Page 160 and 161:
MID YEAR REPORT - DECEMBER 2009 VIG
- Page 162 and 163:
California. We talked about several
- Page 164 and 165:
EXTERNAL POSTDOCTORAL FELLOW REPORT
- Page 166 and 167:
on. While his research area is some
- Page 168 and 169:
POSTDOCTORAL FELLOW REPORT December
- Page 170 and 171:
[1] (with Garcia-Puente, Martin del
- Page 172 and 173:
REPORT FROM MENTOR June 2010 Year e
- Page 174 and 175:
I have also begun working on relate
- Page 176 and 177:
2 Professional Travel Sep. 6 - 26,
- Page 178 and 179:
REPORT FROM MENTOR June 2010 Karl h
- Page 180 and 181:
POSTDOCTORAL FELLOW REPORT June 201
- Page 182 and 183:
REPORT FROM MENTOR June 2010 ------
- Page 184 and 185:
Postdoctoral Program supported by t
- Page 186 and 187:
RO(S 1 )-graded homotopy groups of
- Page 188 and 189:
MSRI POSTDOCTORAL FELLOWSHIP REPORT
- Page 190 and 191:
2 TRISTRAM BOGART and its facets ar
- Page 192 and 193:
To Whom It May Concern: During the
- Page 194 and 195:
MSRI FELLOWSHIP FINAL REPORT SCOTT
- Page 196 and 197:
As his mentor at UCSC, I had freque
- Page 198 and 199:
- UC Davis Combinatorics Seminar -
- Page 200 and 201:
Christopher J. Hillar University of
- Page 202 and 203:
G. Isely, C. Hillar, and F. Sommer,
- Page 204 and 205:
Postdoc Report for: Dr. Christopher
- Page 206 and 207:
2 NSF REPORT FOR ERIC KATZ linear s
- Page 208 and 209:
Year-End Report 2010-11 NSF Math In
- Page 210 and 211:
Jan. 25 - 28, 2011 Recruitment Visi
- Page 212 and 213:
MSRI POSTDOCTORAL FELLOWSHIP REPORT
- Page 214 and 215:
Final report: mentoring Sikimeti Ma
- Page 216 and 217:
eginning of the Fall semester, and
- Page 218 and 219:
MSRI FINAL REPORT JARED SPECK 1. Ba
- Page 220 and 221:
External Postdoctoral Fellows 2009-
- Page 222 and 223:
External Postdoctoral Fellows 2009-
- Page 224 and 225:
2 connections to geometry, topology
- Page 226 and 227:
Connections for Women: Tropical Geo
- Page 228 and 229:
Participant List MSRI Workshop: Con
- Page 230 and 231:
Connections for Women: Tropical Geo
- Page 232 and 233:
2 Combinatorics, Several Complex Va
- Page 234 and 235:
Introductory Workshop: Tropical Geo
- Page 236 and 237:
Currently Available Videos � Sam
- Page 238 and 239:
Name Institution Hering, Milena Uni
- Page 240 and 241:
Introductory Workshop: Tropical Geo
- Page 242 and 243:
analysis. The clarity of Payne’s
- Page 244 and 245:
Tropical Geometry in Combinatorics
- Page 246 and 247:
Currently Available Videos � Sam
- Page 248 and 249:
Name Institution Kharlamov, Viatche
- Page 250 and 251:
Tropical Geometry in Combinatorics
- Page 252 and 253:
Above satisfactory 35 73% Somewhat
- Page 254 and 255:
Tropical structures in geometry and
- Page 256 and 257:
Research Workshop: Tropical Structu
- Page 258 and 259:
Currently Available Videos � Sam
- Page 260 and 261:
Research Workshop: Tropical Structu
- Page 262 and 263:
Algebraic Structures in the Theory
- Page 264 and 265:
2 WORKSHOP REPORT toric fibrations,
- Page 266 and 267:
Algebraic Structures in the Theory
- Page 268 and 269:
Wednesday November 18, 2009 09:00AM
- Page 270 and 271:
Participant List MSRI Workshop: Alg
- Page 272 and 273:
Name Institution Smith, Ivan Centre
- Page 274 and 275:
Research Workshop: Symplectic and C
- Page 276 and 277:
Detailed review: We will now discus
- Page 278 and 279:
Symplectic and Contact Topology and
- Page 280 and 281:
Research Workshop: Symplectic and C
- Page 282 and 283:
Symplectic and Contact Topology and
- Page 284 and 285:
Symplectic and Contact Topology and
- Page 286 and 287:
Final Report MSRI Connections for W
- Page 288 and 289:
Connections : Symplectic and Contac
- Page 290 and 291:
Currently Available Videos � Siki
- Page 292 and 293:
Milin, Isidora University of Illino
- Page 294 and 295:
Final Report Introductory Workshop
- Page 296 and 297:
at a variety of levels. Since a hig
- Page 298 and 299:
Introductory Workshop: Symplectic a
- Page 300 and 301:
Participant List MSRI Workshop: Int
- Page 302 and 303:
Park, Jongil Seoul National Univers
- Page 304 and 305:
Symplectic and Poisson Geometry in
- Page 306 and 307:
Symplectic and Poisson Geometry in
- Page 308 and 309:
Symplectic Geometry, Noncommutative
- Page 310 and 311:
Symplectic Geometry, Noncommutative
- Page 312 and 313:
Symplectic Geometry, Noncommutative
- Page 314 and 315:
09:00AM - 10:00AM Registration 10:0
- Page 316 and 317:
Symplectic Geometry, Noncommutative
- Page 318 and 319:
Symplectic Geometry, Noncommutative
- Page 320 and 321:
REPORT ON THE MSRI WORKSHOP “HOMO
- Page 322 and 323:
of the theory via webs and foams mo
- Page 324 and 325:
Schedule Connections for Women: Hom
- Page 326 and 327:
Connections for Women: Homology The
- Page 328 and 329:
04/29/2010 Connections for Women: H
- Page 330 and 331:
REPORT ON THE MSRI WORKSHOP “INTR
- Page 332 and 333:
INTRODUCTORY WORKSHOP, FINAL REPORT
- Page 334 and 335:
Introductory Workshop: Homology The
- Page 336 and 337:
Connections for Women: Homology The
- Page 338 and 339:
Introductory Workshop: Homology The
- Page 340 and 341:
Introductory Workshop: Homology The
- Page 342 and 343:
Research Workshop: Homology Theorie
- Page 344 and 345:
2 REPORT ON THE MSRI WORKSHOP “HO
- Page 346 and 347:
4 REPORT ON THE MSRI WORKSHOP “HO
- Page 348 and 349:
Schedule Research Workshop: Homolog
- Page 350 and 351:
Currently Available Videos Research
- Page 352 and 353:
Research Workshop: Homology Theorie
- Page 354 and 355:
04/29/2010 Research Workshop: Homol
- Page 356 and 357:
comprehensive lectures explaining t
- Page 358 and 359:
Hot Topics: Black Holes in Relativi
- Page 360 and 361:
Currently Available Videos � Miha
- Page 362 and 363:
Shao, Shuanglin Institute for Advan
- Page 364 and 365:
MATHEMATICAL SCIENCES RESEARCH INST
- Page 366 and 367:
MPDI Summer Institute 2009: Final R
- Page 368 and 369:
school teachers (in the case of sim
- Page 370 and 371:
in length)? The audience would be e
- Page 372 and 373:
Evaluation #1 1. What were the bene
- Page 374 and 375:
Evaluation #2 1. What were the bene
- Page 376 and 377:
6. Do you have to report to an admi
- Page 378 and 379:
your class because your way of teac
- Page 380 and 381:
employee with a summary of what you
- Page 382 and 383:
what have you learned in this insti
- Page 384 and 385:
Evaluation #6 1. What were the bene
- Page 386 and 387:
Evaluation #7 1. What were the bene
- Page 388 and 389:
Evaluation #8 1. What were the bene
- Page 390 and 391:
Evaluation #9 (signed Kelly L.) 1.
- Page 392 and 393:
therefore should not be given the j
- Page 394 and 395:
would you like them organized? Plea
- Page 396 and 397:
Evaluation #11 1. What were the ben
- Page 398 and 399:
Evaluation #12 (signed Jake Disston
- Page 400 and 401:
ideas are insignificant in light of
- Page 402 and 403:
manipulative and pictorial level. F
- Page 404 and 405:
Yes.. I would like to talk to 4 - 6
- Page 406 and 407:
No, but I have continued to make my
- Page 408 and 409:
5. Are you planning to work with co
- Page 410 and 411:
(1) change the order of my curricul
- Page 412 and 413:
I will show my 6th grade teacher co
- Page 414 and 415:
to teaching and planning. Perhaps b
- Page 416 and 417:
III - Develop a lesson on similarit
- Page 418 and 419:
4. What are you going to implement/
- Page 420 and 421:
matics? * How are people teaching t
- Page 422 and 423:
Evaluation #23 (I guess this is Cla
- Page 424 and 425:
Evaluation #24 1. What were the ben
- Page 426 and 427:
2010 Mathematical Sciences Research
- Page 428 and 429:
During the 2007-2009 summers, 46 st
- Page 430 and 431:
MSRI-UP peers promoted mathematical
- Page 432 and 433:
The outcome of all the students’
- Page 434 and 435:
school in mathematics.” They prov
- Page 436 and 437:
16. Evidence Already Pointing to Lo
- Page 438 and 439:
II. Research Projects 1. Your resea
- Page 440 and 441:
5. Is there a workshop, discussion
- Page 442 and 443:
V. Non-Academic Aspects of MSRI-UP
- Page 444 and 445:
MSRI-UP 2010 Calendar, Weeks 1 and
- Page 446 and 447:
MSRI-UP 2010 Calendar, Weeks 5 and
- Page 448 and 449:
In 1945 Stanislaw Ulam posed a ques
- Page 450 and 451:
2.2 Circle Theorem 2. Let r ∈ Q w
- Page 452 and 453:
parabola is (a) The parabola and tw
- Page 454 and 455:
Proof. For each 1 ≤ i < j ≤ 4 w
- Page 456 and 457:
2.5 Non-Concyclic Points on a Parab
- Page 458 and 459:
⎛ ⎜ 1 ⎜ 0 ⎜ 0 ⎜ 0 ⎜ 0
- Page 460 and 461:
following rational points: n23 = Y1
- Page 464 and 465:
Toric Varieties Cox, David Invited
- Page 466 and 467:
Toric varieties Held: June 15-26, 2
- Page 468 and 469:
the graduate participants to hear a
- Page 470 and 471:
This lecture series addressed topic
- Page 472 and 473:
Participant List MSRI Workshop: Sym
- Page 474 and 475:
Example of a Summer Graduate Worksh
- Page 476 and 477:
Random Matrix theory July 6, 2009 t
- Page 478 and 479:
Random Matrix Theory Held: July 6 -
- Page 480 and 481:
Participant List MSRI Workshop: Ran
- Page 482 and 483:
Below is the list of topics conside
- Page 484 and 485:
stability estimates for the inverse
- Page 486 and 487:
Participant List MSRI Workshop: Inv
- Page 488 and 489:
The Arithmetic of L-Functions IAS/P
- Page 490 and 491:
ackground material on group represe
- Page 492 and 493:
Computational Theory of Real Reduct