E_mg_GB_03_vorne-29_3_04
E_mg_GB_03_vorne-29_3_04
E_mg_GB_03_vorne-29_3_04

Create successful ePaper yourself
Turn your PDF publications into a flip-book with our unique Google optimized e-Paper software.
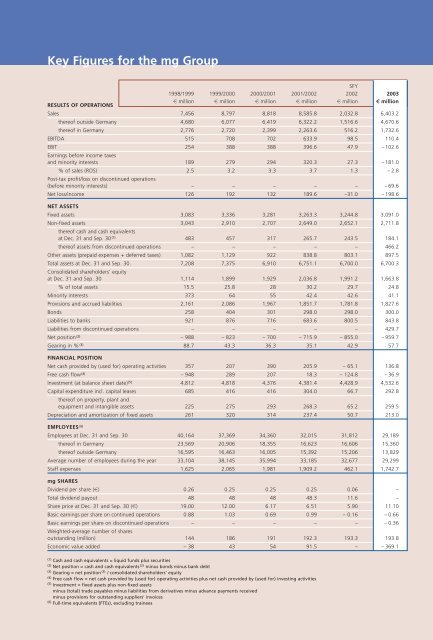
Key Figures for the <strong>mg</strong> Group<br />
RESULTS OF OPERATIONS<br />
SFY<br />
1998/1999 1999/2000 2000/2001 2001/2002 2002 20<strong>03</strong><br />
s million s million s million s million s million u million<br />
Sales 7,456 8,797 8,818 8,585.8 2,<strong>03</strong>2.8 6,4<strong>03</strong>.2<br />
thereof outside Germany 4,680 6,077 6,419 6,322.2 1,516.6 4,670.6<br />
thereof in Germany 2,776 2,720 2,399 2,263.6 516.2 1,732.6<br />
EBITDA 515 708 702 633.9 98.5 110.4<br />
EBIT<br />
Earnings before income taxes<br />
254 388 388 396.6 47.9 – 102.6<br />
and minority interests 189 279 <strong>29</strong>4 320.3 27.3 – 181.0<br />
% of sales (ROS)<br />
Post-tax profit/loss on discontinued operations<br />
2.5 3.2 3.3 3.7 1.3 – 2.8<br />
(before minority interests) – – – – – –69.6<br />
Net loss/income 126 192 132 189.6 –31.0 – 198.6<br />
NET ASSETS<br />
Fixed assets 3,083 3,336 3,281 3,263.3 3,244.8 3,091.0<br />
Non-fixed assets<br />
thereof cash and cash equivalents<br />
3,<strong>04</strong>3 2,910 2,707 2,649.0 2,652.1 2,711.8<br />
at Dec. 31 and Sep. 30 (1) 483 457 317 265.7 243.5 184.1<br />
thereof assets from discontinued operations – – – – – 466.2<br />
Other assets (prepaid expenses + deferred taxes) 1,082 1,1<strong>29</strong> 922 838.8 8<strong>03</strong>.1 897.5<br />
Total assets at Dec. 31 and Sep. 30.<br />
Consolidated shareholders’ equity<br />
7,208 7,375 6,910 6,751.1 6,700.0 6,700.3<br />
at Dec. 31 and Sep. 30 1,114 1,899 1,9<strong>29</strong> 2,<strong>03</strong>6.8 1,991.2 1,663.8<br />
% of total assets 15.5 25.8 28 30.2 <strong>29</strong>.7 24.8<br />
Minority interests 373 64 55 42.4 42.6 41.1<br />
Provisions and accrued liabilities 2,161 2,086 1,967 1,851.7 1,781.8 1,827.6<br />
Bonds 258 4<strong>04</strong> 301 <strong>29</strong>8.0 <strong>29</strong>8.0 300.0<br />
Liabilities to banks 921 876 716 683.6 800.5 843.8<br />
Liabilities from discontinued operations – – – – – 4<strong>29</strong>.7<br />
Net position (2) – 988 – 823 – 700 – 715.9 – 855.0 – 959.7<br />
Gearing in % (3) 88.7 43.3 36.3 35.1 42.9 57.7<br />
FINANCIAL POSITION<br />
Net cash provided by (used for) operating activities 357 207 390 205.9 – 65.1 136.8<br />
Free cash flow (4) – 948 289 207 18.3 – 124.8 – 36.9<br />
Investment (at balance sheet date) (5) 4,812 4,818 4,376 4,381.4 4,428.9 4,532.6<br />
Capital expenditure incl. capital leases<br />
thereof on property, plant and<br />
685 416 416 3<strong>04</strong>.0 66.7 <strong>29</strong>2.8<br />
equipment and intangible assets 225 275 <strong>29</strong>3 268.3 65.2 259.5<br />
Depreciation and amortization of fixed assets 261 320 314 237.4 50.7 213.0<br />
EMPLOYEES (6)<br />
Employees at Dec. 31 and Sep. 30 40,164 37,369 34,360 32,015 31,812 <strong>29</strong>,189<br />
thereof in Germany 23,569 20,906 18,355 16,623 16,606 15,360<br />
thereof outside Germany 16,595 16,463 16,005 15,392 15,206 13,8<strong>29</strong><br />
Average number of employees during the year 33,1<strong>04</strong> 38,145 35,994 33,185 32,677 <strong>29</strong>,<strong>29</strong>9<br />
Staff expenses 1,625 2,065 1,981 1,909.2 462.1 1,742.7<br />
<strong>mg</strong> SHARES<br />
Dividend per share (s) 0.26 0.25 0.25 0.25 0.06 –<br />
Total dividend payout 48 48 48 48.3 11.6 –<br />
Share price at Dec. 31 and Sep. 30 (s) 19.00 12.00 6.17 6.51 5.90 11.10<br />
Basic earnings per share on continued operations 0.88 1.<strong>03</strong> 0.69 0.99 – 0.16 – 0.66<br />
Basic earnings per share on discontinued operations<br />
Weighted-average number of shares<br />
– – – – – –0.36<br />
outstanding (million) 144 186 191 192.3 193.3 193.8<br />
Economic value added – 38 43 54 91.5 – – 369.1<br />
(1) Cash and cash equivalents = liquid funds plus securities<br />
(2) Net position = cash and cash equivalents (2) minus bonds minus bank debt<br />
(3) Gearing = net position (3) / consolidated shareholders’ equity<br />
(4) Free cash flow = net cash provided by (used for) operating activities plus net cash provided by (used for) investing activities<br />
(5) Investment = fixed assets plus non-fixed assets<br />
minus (total) trade payables minus liabilities from derivatives minus advance payments received<br />
minus provisions for outstanding suppliers’ invoices<br />
(6) Full-time equivalents (FTEs), excluding trainees