E_mg_GB_03_vorne-29_3_04
E_mg_GB_03_vorne-29_3_04
E_mg_GB_03_vorne-29_3_04

You also want an ePaper? Increase the reach of your titles
YUMPU automatically turns print PDFs into web optimized ePapers that Google loves.
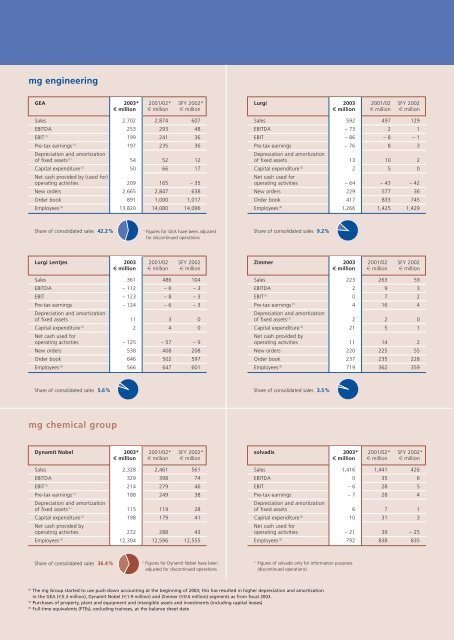
<strong>mg</strong> engineering<br />
GEA 20<strong>03</strong>* 2001/02* SFY 2002*<br />
u million s million s million<br />
Sales 2,702 2,874 607<br />
EBITDA 253 <strong>29</strong>3 48<br />
EBIT (1) 199 241 36<br />
Pre-tax earnings (1) Depreciation and amortization<br />
197 235 36<br />
of fixed assets (1) 54 52 12<br />
Capital expenditure (2) Net cash provided by (used for)<br />
50 66 17<br />
operating activities 209 165 – 35<br />
New orders 2,665 2,847 638<br />
Order book 891 1,000 1,017<br />
Employees (3) 13,820 14,080 14,096<br />
Share of consolidated sales 42.2%<br />
Lurgi Lentjes 20<strong>03</strong> 2001/02 SFY 2002<br />
u million s million s million<br />
Sales 361 486 1<strong>04</strong><br />
EBITDA – 112 – 6 – 3<br />
EBIT – 123 – 8 – 3<br />
Pre-tax earnings<br />
Depreciation and amortization<br />
– 124 – 6 – 3<br />
of fixed assets 11 3 0<br />
Capital expenditure (2) Net cash used for<br />
2 4 0<br />
operating activities – 125 – 57 – 9<br />
New orders 538 408 208<br />
Order book 646 502 597<br />
Employees (3) 566 647 601<br />
Share of consolidated sales 5.6%<br />
<strong>mg</strong> chemical group<br />
Share of consolidated sales 36.4%<br />
*) Figures for GEA have been adjusted<br />
for discontinued operations<br />
Dynamit Nobel 20<strong>03</strong>* 2001/02* SFY 2002*<br />
u million s million s million<br />
Sales 2,328 2,461 561<br />
EBITDA 3<strong>29</strong> 398 74<br />
EBIT (1) 214 279 46<br />
Pre-tax earnings (1) Depreciation and amortization<br />
188 249 38<br />
of fixed assets (1) 115 119 28<br />
Capital expenditure (2) Net cash provided by<br />
198 179 41<br />
operating activities 272 288 43<br />
Employees (3) 12,3<strong>04</strong> 12,596 12,555<br />
*) Figures for Dynamit Nobel have been<br />
adjusted for discontinued operations<br />
Lurgi 20<strong>03</strong> 2001/02 SFY 2002<br />
u million s million s million<br />
Sales 592 497 1<strong>29</strong><br />
EBITDA – 73 2 1<br />
EBIT – 86 – 8 – 1<br />
Pre-tax earnings<br />
Depreciation and amortization<br />
– 76 8 3<br />
of fixed assets 13 10 2<br />
Capital expenditure (2) Net cash used for<br />
2 5 0<br />
operating activities – 64 – 43 – 42<br />
New orders 2<strong>29</strong> 577 36<br />
Order book 417 833 745<br />
Employees (3) 1,266 1,425 1,4<strong>29</strong><br />
Share of consolidated sales 9.2%<br />
Zimmer 20<strong>03</strong> 2001/02 SFY 2002<br />
u million s million s million<br />
Sales 223 263 59<br />
EBITDA 2 9 3<br />
EBIT (1) 0 7 2<br />
Pre-tax earnings (1) Depreciation and amortization<br />
4 16 4<br />
of fixed assets (1) 2 2 0<br />
Capital expenditure (2) Net cash provided by<br />
21 5 1<br />
operating activities 11 14 2<br />
New orders 220 225 55<br />
Order book 237 235 228<br />
Employees (3) 719 362 359<br />
Share of consolidated sales 3.5%<br />
(1) The <strong>mg</strong> Group started to use push-down accounting at the beginning of 20<strong>03</strong>; this has resulted in higher depreciation and amortization<br />
in the GEA (P5.3 million), Dynamit Nobel (P1.9 million) and Zimmer (P0.6 million) segments as from fiscal 20<strong>03</strong>.<br />
(2) Purchases of property, plant and equipment and intangible assets and investments (including capital leases)<br />
(3) Full-time equivalents (FTEs), excluding trainees, at the balance sheet date<br />
solvadis 20<strong>03</strong>* 2001/02* SFY 2002*<br />
u million s million s million<br />
Sales 1,416 1,441 426<br />
EBITDA 0 35 6<br />
EBIT – 6 28 5<br />
Pre-tax earnings<br />
Depreciation and amortization<br />
– 7 28 4<br />
of fixed assets 6 7 1<br />
Capital expenditure (2) Net cash used for<br />
10 31 3<br />
operating activities – 21 39 – 25<br />
Employees (3) 792 838 835<br />
*) Figures of solvadis only for information purposes<br />
(discontinued operations)