Social Security Disability Insurance (SSDI) - National Technical ...
Social Security Disability Insurance (SSDI) - National Technical ...
Social Security Disability Insurance (SSDI) - National Technical ...

Create successful ePaper yourself
Turn your PDF publications into a flip-book with our unique Google optimized e-Paper software.
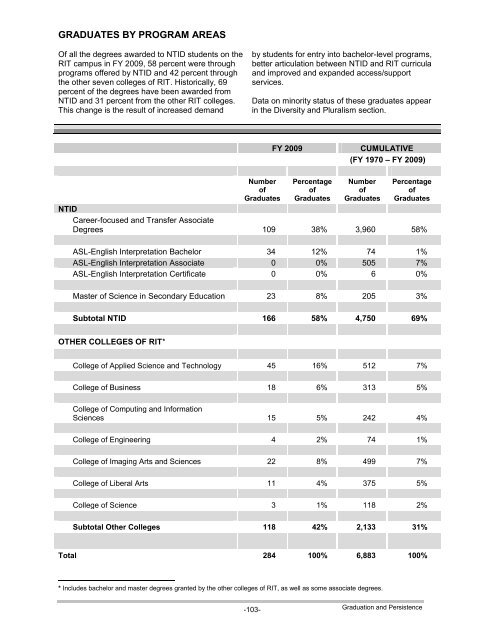
GRADUATES BY PROGRAM AREAS<br />
Of all the degrees awarded to NTID students on the<br />
RIT campus in FY 2009, 58 percent were through<br />
programs offered by NTID and 42 percent through<br />
the other seven colleges of RIT. Historically, 69<br />
percent of the degrees have been awarded from<br />
NTID and 31 percent from the other RIT colleges.<br />
This change is the result of increased demand<br />
by students for entry into bachelor-level programs,<br />
better articulation between NTID and RIT curricula<br />
and improved and expanded access/support<br />
services.<br />
Data on minority status of these graduates appear<br />
in the Diversity and Pluralism section.<br />
Number<br />
of<br />
Graduates<br />
-103-<br />
FY 2009 CUMULATIVE<br />
(FY 1970 – FY 2009)<br />
Percentage<br />
of<br />
Graduates<br />
Number<br />
of<br />
Graduates<br />
Percentage<br />
of<br />
Graduates<br />
NTID<br />
Career-focused and Transfer Associate<br />
Degrees 109 38% 3,960 58%<br />
ASL-English Interpretation Bachelor 34 12% 74 1%<br />
ASL-English Interpretation Associate 0 0% 505 7%<br />
ASL-English Interpretation Certificate 0 0% 6 0%<br />
Master of Science in Secondary Education 23 8% 205 3%<br />
Subtotal NTID 166 58% 4,750 69%<br />
OTHER COLLEGES OF RIT*<br />
College of Applied Science and Technology 45 16% 512 7%<br />
College of Business 18 6% 313 5%<br />
College of Computing and Information<br />
Sciences 15 5% 242 4%<br />
College of Engineering 4 2% 74 1%<br />
College of Imaging Arts and Sciences 22 8% 499 7%<br />
College of Liberal Arts 11 4% 375 5%<br />
College of Science 3 1% 118 2%<br />
Subtotal Other Colleges 118 42% 2,133 31%<br />
Total 284 100% 6,883 100%<br />
* Includes bachelor and master degrees granted by the other colleges of RIT, as well as some associate degrees.<br />
Graduation and Persistence