Social Security Disability Insurance (SSDI) - National Technical ...
Social Security Disability Insurance (SSDI) - National Technical ...
Social Security Disability Insurance (SSDI) - National Technical ...

Create successful ePaper yourself
Turn your PDF publications into a flip-book with our unique Google optimized e-Paper software.
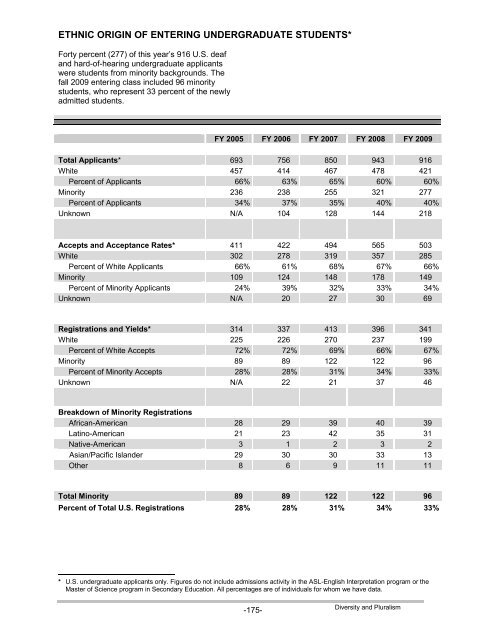
ETHNIC ORIGIN OF ENTERING UNDERGRADUATE STUDENTS*<br />
Forty percent (277) of this year’s 916 U.S. deaf<br />
and hard-of-hearing undergraduate applicants<br />
were students from minority backgrounds. The<br />
fall 2009 entering class included 96 minority<br />
students, who represent 33 percent of the newly<br />
admitted students.<br />
FY 2005 FY 2006 FY 2007 FY 2008 FY 2009<br />
Total Applicants* 693 756 850 943 916<br />
White 457 414 467 478 421<br />
Percent of Applicants 66% 63% 65% 60% 60%<br />
Minority 236 238 255 321 277<br />
Percent of Applicants 34% 37% 35% 40% 40%<br />
Unknown N/A 104 128 144 218<br />
Accepts and Acceptance Rates* 411 422 494 565 503<br />
White 302 278 319 357 285<br />
Percent of White Applicants 66% 61% 68% 67% 66%<br />
Minority 109 124 148 178 149<br />
Percent of Minority Applicants 24% 39% 32% 33% 34%<br />
Unknown N/A 20 27 30 69<br />
Registrations and Yields* 314 337 413 396 341<br />
White 225 226 270 237 199<br />
Percent of White Accepts 72% 72% 69% 66% 67%<br />
Minority 89 89 122 122 96<br />
Percent of Minority Accepts 28% 28% 31% 34% 33%<br />
Unknown N/A 22 21 37 46<br />
Breakdown of Minority Registrations<br />
African-American 28 29 39 40 39<br />
Latino-American 21 23 42 35 31<br />
Native-American 3 1 2 3 2<br />
Asian/Pacific Islander 29 30 30 33 13<br />
Other 8 6 9 11 11<br />
Total Minority 89 89 122 122 96<br />
Percent of Total U.S. Registrations 28% 28% 31% 34% 33%<br />
* U.S. undergraduate applicants only. Figures do not include admissions activity in the ASL-English Interpretation program or the<br />
Master of Science program in Secondary Education. All percentages are of individuals for whom we have data.<br />
-175-<br />
Diversity and Pluralism