Social Security Disability Insurance (SSDI) - National Technical ...
Social Security Disability Insurance (SSDI) - National Technical ...
Social Security Disability Insurance (SSDI) - National Technical ...

Create successful ePaper yourself
Turn your PDF publications into a flip-book with our unique Google optimized e-Paper software.
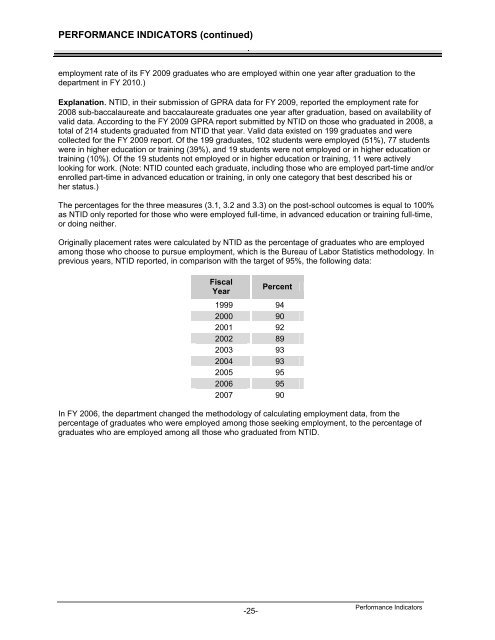
PERFORMANCE INDICATORS (continued)<br />
employment rate of its FY 2009 graduates who are employed within one year after graduation to the<br />
department in FY 2010.)<br />
Explanation. NTID, in their submission of GPRA data for FY 2009, reported the employment rate for<br />
2008 sub-baccalaureate and baccalaureate graduates one year after graduation, based on availability of<br />
valid data. According to the FY 2009 GPRA report submitted by NTID on those who graduated in 2008, a<br />
total of 214 students graduated from NTID that year. Valid data existed on 199 graduates and were<br />
collected for the FY 2009 report. Of the 199 graduates, 102 students were employed (51%), 77 students<br />
were in higher education or training (39%), and 19 students were not employed or in higher education or<br />
training (10%). Of the 19 students not employed or in higher education or training, 11 were actively<br />
looking for work. (Note: NTID counted each graduate, including those who are employed part-time and/or<br />
enrolled part-time in advanced education or training, in only one category that best described his or<br />
her status.)<br />
The percentages for the three measures (3.1, 3.2 and 3.3) on the post-school outcomes is equal to 100%<br />
as NTID only reported for those who were employed full-time, in advanced education or training full-time,<br />
or doing neither.<br />
Originally placement rates were calculated by NTID as the percentage of graduates who are employed<br />
among those who choose to pursue employment, which is the Bureau of Labor Statistics methodology. In<br />
previous years, NTID reported, in comparison with the target of 95%, the following data:<br />
Fiscal<br />
Year<br />
-25-<br />
Percent<br />
1999 94<br />
2000 90<br />
2001 92<br />
2002 89<br />
2003 93<br />
2004 93<br />
2005 95<br />
2006 95<br />
2007 90<br />
In FY 2006, the department changed the methodology of calculating employment data, from the<br />
percentage of graduates who were employed among those seeking employment, to the percentage of<br />
graduates who are employed among all those who graduated from NTID.<br />
Performance Indicators