Image Reconstruction for 3D Lung Imaging - Department of Systems ...
Image Reconstruction for 3D Lung Imaging - Department of Systems ...
Image Reconstruction for 3D Lung Imaging - Department of Systems ...

Create successful ePaper yourself
Turn your PDF publications into a flip-book with our unique Google optimized e-Paper software.
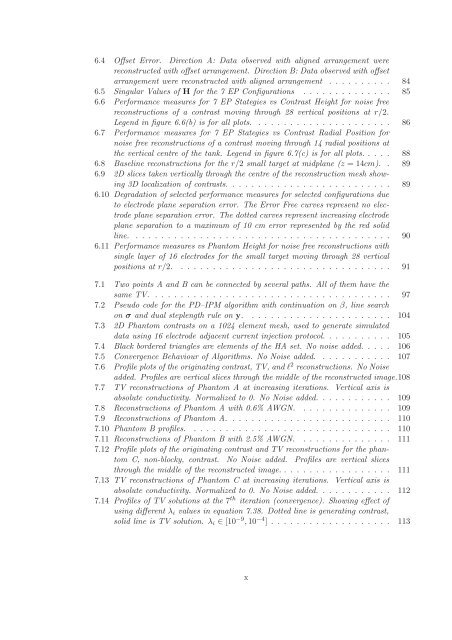
6.4 Offset Error. Direction A: Data observed with aligned arrangement were<br />
reconstructed with <strong>of</strong>fset arrangement. Direction B: Data observed with <strong>of</strong>fset<br />
arrangement were reconstructed with aligned arrangement . . . . . . . . . . 84<br />
6.5 Singular Values <strong>of</strong> H <strong>for</strong> the 7 EP Configurations . . . . . . . . . . . . . . 85<br />
6.6 Per<strong>for</strong>mance measures <strong>for</strong> 7 EP Stategies vs Contrast Height <strong>for</strong> noise free<br />
reconstructions <strong>of</strong> a contrast moving through 28 vertical positions at r/2.<br />
Legend in figure 6.6(b) is <strong>for</strong> all plots. . . . . . . . . . . . . . . . . . . . . . 86<br />
6.7 Per<strong>for</strong>mance measures <strong>for</strong> 7 EP Stategies vs Contrast Radial Position <strong>for</strong><br />
noise free reconstructions <strong>of</strong> a contrast moving through 14 radial positions at<br />
the vertical centre <strong>of</strong> the tank. Legend in figure 6.7(c) is <strong>for</strong> all plots. . . . . 88<br />
6.8 Baseline reconstructions <strong>for</strong> the r/2 small target at midplane (z = 14cm). . 89<br />
6.9 2D slices taken vertically through the centre <strong>of</strong> the reconstruction mesh showing<br />
<strong>3D</strong> localization <strong>of</strong> contrasts. . . . . . . . . . . . . . . . . . . . . . . . . . 89<br />
6.10 Degradation <strong>of</strong> selected per<strong>for</strong>mance measures <strong>for</strong> selected configurations due<br />
to electrode plane separation error. The Error Free curves represent no electrode<br />
plane separation error. The dotted curves represent increasing electrode<br />
plane separation to a maximum <strong>of</strong> 10 cm error represented by the red solid<br />
line. . . . . . . . . . . . . . . . . . . . . . . . . . . . . . . . . . . . . . . . . 90<br />
6.11 Per<strong>for</strong>mance measures vs Phantom Height <strong>for</strong> noise free reconstructions with<br />
single layer <strong>of</strong> 16 electrodes <strong>for</strong> the small target moving through 28 vertical<br />
positions at r/2. . . . . . . . . . . . . . . . . . . . . . . . . . . . . . . . . . 91<br />
7.1 Two points A and B can be connected by several paths. All <strong>of</strong> them have the<br />
same TV. . . . . . . . . . . . . . . . . . . . . . . . . . . . . . . . . . . . . . 97<br />
7.2 Pseudo code <strong>for</strong> the PD–IPM algorithm with continuation on β, line search<br />
on σ and dual steplength rule on y. . . . . . . . . . . . . . . . . . . . . . . 104<br />
7.3 2D Phantom contrasts on a 1024 element mesh, used to generate simulated<br />
data using 16 electrode adjacent current injection protocol. . . . . . . . . . . 105<br />
7.4 Black bordered triangles are elements <strong>of</strong> the HA set. No noise added. . . . . 106<br />
7.5 Convergence Behaviour <strong>of</strong> Algorithms. No Noise added. . . . . . . . . . . . 107<br />
7.6 Pr<strong>of</strong>ile plots <strong>of</strong> the originating contrast, TV, and ℓ 2 reconstructions. No Noise<br />
added. Pr<strong>of</strong>iles are vertical slices through the middle <strong>of</strong> the reconstructed image.108<br />
7.7 TV reconstructions <strong>of</strong> Phantom A at increasing iterations. Vertical axis is<br />
absolute conductivity. Normalized to 0. No Noise added. . . . . . . . . . . . 109<br />
7.8 <strong>Reconstruction</strong>s <strong>of</strong> Phantom A with 0.6% AWGN. . . . . . . . . . . . . . . 109<br />
7.9 <strong>Reconstruction</strong>s <strong>of</strong> Phantom A. . . . . . . . . . . . . . . . . . . . . . . . . . 110<br />
7.10 Phantom B pr<strong>of</strong>iles. . . . . . . . . . . . . . . . . . . . . . . . . . . . . . . . 110<br />
7.11 <strong>Reconstruction</strong>s <strong>of</strong> Phantom B with 2.5% AWGN. . . . . . . . . . . . . . . 111<br />
7.12 Pr<strong>of</strong>ile plots <strong>of</strong> the originating contrast and TV reconstructions <strong>for</strong> the phantom<br />
C, non-blocky, contrast. No Noise added. Pr<strong>of</strong>iles are vertical slices<br />
through the middle <strong>of</strong> the reconstructed image. . . . . . . . . . . . . . . . . . 111<br />
7.13 TV reconstructions <strong>of</strong> Phantom C at increasing iterations. Vertical axis is<br />
absolute conductivity. Normalized to 0. No Noise added. . . . . . . . . . . . 112<br />
7.14 Pr<strong>of</strong>iles <strong>of</strong> TV solutions at the 7 th iteration (convergence). Showing effect <strong>of</strong><br />
using different λi values in equation 7.38. Dotted line is generating contrast,<br />
solid line is TV solution. λi ∈ [10 −9 ,10 −4 ] . . . . . . . . . . . . . . . . . . . 113<br />
x