Image Reconstruction for 3D Lung Imaging - Department of Systems ...
Image Reconstruction for 3D Lung Imaging - Department of Systems ...
Image Reconstruction for 3D Lung Imaging - Department of Systems ...

Create successful ePaper yourself
Turn your PDF publications into a flip-book with our unique Google optimized e-Paper software.
GCV<br />
1.8<br />
1.6<br />
1.4<br />
1.2<br />
1<br />
0.8<br />
0.6<br />
0.4<br />
0.2<br />
GCV(λ diag(H))<br />
GCV(λHPF)<br />
Local Minimums<br />
10 −6 10 −4 10 −2 10 0 10 2<br />
log10(λ)<br />
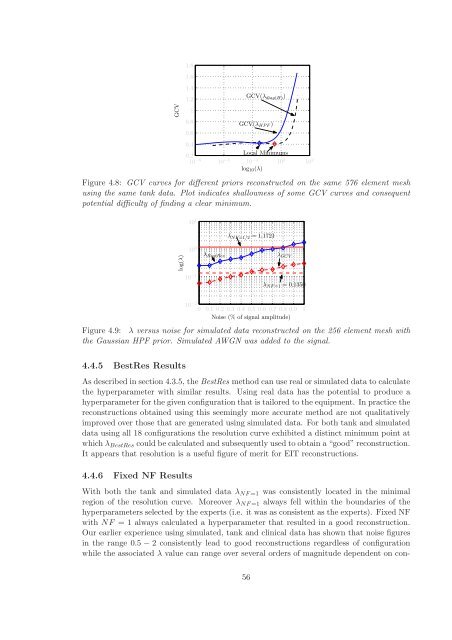
Figure 4.8: GCV curves <strong>for</strong> different priors reconstructed on the same 576 element mesh<br />
using the same tank data. Plot indicates shallowness <strong>of</strong> some GCV curves and consequent<br />
potential difficulty <strong>of</strong> finding a clear minimum.<br />
log(λ)<br />
10 1<br />
10 0<br />
10 −1<br />
λBestRes<br />
λ NF=1/2 = 1.1721<br />
λGCV<br />
λNF=1 = 0.1350<br />
10<br />
0 0.1 0.2 0.3 0.4 0.5 0.6 0.7 0.8 0.9 1<br />
Noise (% <strong>of</strong> signal amplitude)<br />
−2<br />
Figure 4.9: λ versus noise <strong>for</strong> simulated data reconstructed on the 256 element mesh with<br />
the Gaussian HPF prior. Simulated AWGN was added to the signal.<br />
4.4.5 BestRes Results<br />
As described in section 4.3.5, the BestRes method can use real or simulated data to calculate<br />
the hyperparameter with similar results. Using real data has the potential to produce a<br />
hyperparameter <strong>for</strong> the given configuration that is tailored to the equipment. In practice the<br />
reconstructions obtained using this seemingly more accurate method are not qualitatively<br />
improved over those that are generated using simulated data. For both tank and simulated<br />
data using all 18 configurations the resolution curve exhibited a distinct minimum point at<br />
which λBestRes could be calculated and subsequently used to obtain a “good” reconstruction.<br />
It appears that resolution is a useful figure <strong>of</strong> merit <strong>for</strong> EIT reconstructions.<br />
4.4.6 Fixed NF Results<br />
With both the tank and simulated data λNF=1 was consistently located in the minimal<br />
region <strong>of</strong> the resolution curve. Moreover λNF=1 always fell within the boundaries <strong>of</strong> the<br />
hyperparameters selected by the experts (i.e. it was as consistent as the experts). Fixed NF<br />
with NF = 1 always calculated a hyperparameter that resulted in a good reconstruction.<br />
Our earlier experience using simulated, tank and clinical data has shown that noise figures<br />
in the range 0.5 − 2 consistently lead to good reconstructions regardless <strong>of</strong> configuration<br />
while the associated λ value can range over several orders <strong>of</strong> magnitude dependent on con-<br />
56