Image Reconstruction for 3D Lung Imaging - Department of Systems ...
Image Reconstruction for 3D Lung Imaging - Department of Systems ...
Image Reconstruction for 3D Lung Imaging - Department of Systems ...

You also want an ePaper? Increase the reach of your titles
YUMPU automatically turns print PDFs into web optimized ePapers that Google loves.
log10||Rˆx||<br />
10 2<br />
10 1<br />
10 0<br />
10 −1<br />
10 −2<br />
10 −3<br />
λ=1.1502e-006<br />
λLC<br />
λGCV<br />
λNF=1<br />
λBestRes<br />
log10||Hˆx − z||<br />
(a) L-Curve<br />
λ=13.033<br />
10 −0.8 10 −0.7 10 −0.6<br />
Blur Radius<br />
0.46<br />
0.44<br />
0.42<br />
0.4<br />
0.38<br />
0.36<br />
0.34<br />
0.32<br />
λLC<br />
λGCV<br />
λNF=1<br />
λBestRes<br />
0.3<br />
-5 -4 -3 -2 -1 0 1<br />
log10(λ)<br />
(b) Resolution<br />
log10(λ))<br />
Curve (Blur Radius vs<br />
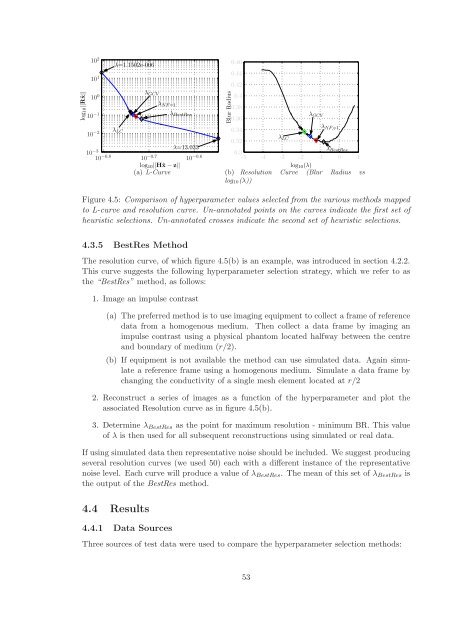
Figure 4.5: Comparison <strong>of</strong> hyperparameter values selected from the various methods mapped<br />
to L-curve and resolution curve. Un-annotated points on the curves indicate the first set <strong>of</strong><br />
heuristic selections. Un-annotated crosses indicate the second set <strong>of</strong> heuristic selections.<br />
4.3.5 BestRes Method<br />
The resolution curve, <strong>of</strong> which figure 4.5(b) is an example, was introduced in section 4.2.2.<br />
This curve suggests the following hyperparameter selection strategy, which we refer to as<br />
the “BestRes” method, as follows:<br />
1. <strong>Image</strong> an impulse contrast<br />
(a) The preferred method is to use imaging equipment to collect a frame <strong>of</strong> reference<br />
data from a homogenous medium. Then collect a data frame by imaging an<br />
impulse contrast using a physical phantom located halfway between the centre<br />
and boundary <strong>of</strong> medium (r/2).<br />
(b) If equipment is not available the method can use simulated data. Again simulate<br />
a reference frame using a homogenous medium. Simulate a data frame by<br />
changing the conductivity <strong>of</strong> a single mesh element located at r/2<br />
2. Reconstruct a series <strong>of</strong> images as a function <strong>of</strong> the hyperparameter and plot the<br />
associated Resolution curve as in figure 4.5(b).<br />
3. Determine λBestRes as the point <strong>for</strong> maximum resolution - minimum BR. This value<br />
<strong>of</strong> λ is then used <strong>for</strong> all subsequent reconstructions using simulated or real data.<br />
If using simulated data then representative noise should be included. We suggest producing<br />
several resolution curves (we used 50) each with a different instance <strong>of</strong> the representative<br />
noise level. Each curve will produce a value <strong>of</strong> λBestRes. The mean <strong>of</strong> this set <strong>of</strong> λBestRes is<br />
the output <strong>of</strong> the BestRes method.<br />
4.4 Results<br />
4.4.1 Data Sources<br />
Three sources <strong>of</strong> test data were used to compare the hyperparameter selection methods:<br />
53