Planning for Sport and Active Recreation Facilities ... - Brent Council
Planning for Sport and Active Recreation Facilities ... - Brent Council
Planning for Sport and Active Recreation Facilities ... - Brent Council

You also want an ePaper? Increase the reach of your titles
YUMPU automatically turns print PDFs into web optimized ePapers that Google loves.
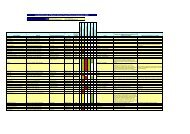
<strong>and</strong> Tables within the strategy<br />
Graph Map Table Description Page<br />
Map 22 Example of travel time to facilities map 42<br />
Map 23 Location of <strong>Brent</strong>’s sports centres 46<br />
Table 12 Swimming pools in <strong>Brent</strong> 47<br />
Table 13 Capacity ratios - swimming pools 48<br />
Map 24 Walking time to the nearest publicly accessible swimming pool 48<br />
Map 25 Catchment map - swimming pools 49<br />
Map 26 Swimming pools within 1.6km catchment including neighbouring<br />
boroughs’ facilities<br />
Graph 5 % population within 20mins walking time of pool sites 50<br />
Map 27 Travel time map - swimming pools 50<br />
Map 28 Personal share - swimming pools 51<br />
Graph 6 Levels of unmet <strong>and</strong> met dem<strong>and</strong>, capacity <strong>and</strong> utilised capacity <strong>for</strong><br />
swimming pools<br />
Map 29 Unmet dem<strong>and</strong> in 2016 - swimming pools 52<br />
Map 30 Catchment map - sports halls 53<br />
Table 14 <strong>Sport</strong>s halls in <strong>Brent</strong> 54<br />
Table 15 Capacity ratios - sports halls 56<br />
Map 31 Travel time map - sports halls 57<br />
Map 32 Personal share - sports halls 57<br />
Graph 7 % population within 20mins walking time of sports halls 58<br />
Map 33 Unmet dem<strong>and</strong> 2007 - sports halls 58<br />
Table 16 Health <strong>and</strong> fitness facilities in <strong>Brent</strong> 60<br />
Table 17 Capacity ratios - health <strong>and</strong> fitness 61<br />
Map 34 Catchment map - health <strong>and</strong> fitness facilities 62<br />
Map 35 Travel time map - health <strong>and</strong> fitness 62<br />
Table 18 Gym memberships 63<br />
Map 36 Catchment map - indoor athletics 64<br />
Table 19 Capacity ratio - indoor bowls 65<br />
Map 37 Catchment map - indoor bowls 65<br />
Map 38 Travel time map - indoor bowls 65<br />
Map 39 Catchment map - squash 66<br />
Table 20 Capacity ratio - indoor tennis 67<br />
Map 40 Travel time map - indoor tennis 67<br />
Table 21 Number of pitches by each pitch type 70<br />
Table 22 Pitch quality ratings 70<br />
Table 23 Changing facilities quality ratings 71<br />
Table 24 Total number of football pitches in <strong>Brent</strong> 72<br />
Table 25 Area of football pitches in <strong>Brent</strong> 72<br />
Map 41 Catchment map - football pitches 72<br />
Table 26 Dem<strong>and</strong> <strong>for</strong> football pitches 73<br />
Table 27 Rugby pitches in <strong>Brent</strong> 74<br />
Map 42 Catchment map - rugby pitches 74<br />
Tables of Maps, Graphs <strong>and</strong> Tables within the strategy 112<br />
49<br />
51

![0702012-khat[1] - Brent Council](https://img.yumpu.com/11457346/1/184x260/0702012-khat1-brent-council.jpg?quality=85)