Planning for Sport and Active Recreation Facilities ... - Brent Council
Planning for Sport and Active Recreation Facilities ... - Brent Council
Planning for Sport and Active Recreation Facilities ... - Brent Council

You also want an ePaper? Increase the reach of your titles
YUMPU automatically turns print PDFs into web optimized ePapers that Google loves.
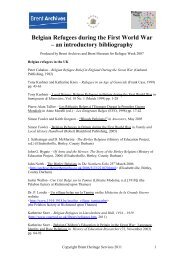
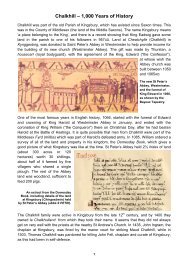
Map 5: The most <strong>and</strong> least income deprived wards in<br />
the borough.<br />
Kenton<br />
Northwick Park<br />
Sudbury<br />
Health<br />
Preston<br />
Queensbury<br />
Barnhill<br />
Wembley Central<br />
Tokyngton<br />
Fryent<br />
Welsh Harp<br />
Brondesbury Park<br />
Harlesden<br />
Alperton<br />
Stonebridge<br />
Kilburn<br />
Kensal Green Queen’s Park<br />
Legend<br />
Ward Boundaries<br />
Borough Boundary<br />
Most income deprived<br />
Least income deprived<br />
Dollis Hill<br />
Dudden Hill Mapesbury<br />
Willesden Green<br />
Legend<br />
There are significant health<br />
inequalities in the borough,<br />
linked to location, gender, level<br />
of deprivation <strong>and</strong> ethnicity. The<br />
most deprived wards in the South<br />
of the borough have a higher death<br />
rate, <strong>and</strong> lower life expectancy than<br />
the less deprived wards in the North<br />
of the borough. The prevalence of<br />
diabetes in <strong>Brent</strong> is high compared<br />
to the national average with 4.6%<br />
of the population being diagnosed<br />
with the condition, although the<br />
proportion that are undiagnosed<br />
may be closer to 6%. <strong>Brent</strong> has one of the<br />
highest rates of TB in London <strong>and</strong> in Engl<strong>and</strong>.<br />
Ward Boundaries<br />
Borough Boundary<br />
KENTON<br />
Northwick Park<br />
Sudbury<br />
Kenton<br />
The 2001 Census found 70% of <strong>Brent</strong>’s<br />
population to be in good health, with 21%<br />
rated fairly good <strong>and</strong> 9% as not good. Over<br />
the last ten years, rates of deaths from all causes have<br />
decreased <strong>for</strong> both men <strong>and</strong> women <strong>and</strong> are lower than<br />
the Engl<strong>and</strong> average. Circulatory diseases, including heart<br />
15<br />
S. KENTON<br />
disease, strokes <strong>and</strong> cancers, are the most common cause<br />
of death in <strong>Brent</strong>. The health status of the Borough is also<br />
a reflection of income deprivation with the prevalence of<br />
life limiting health conditions <strong>and</strong> lower life expectancy in<br />
the most deprived wards in the south of the Borough.<br />
The prevalence of diabetes in <strong>Brent</strong> is high compared to<br />
the national average with 4.6% of the population being<br />
diagnosed with the condition. <strong>Brent</strong> also has one of the<br />
highest rates of TB in London <strong>and</strong> in Engl<strong>and</strong>.<br />
The Department of Health’s 2007 health profile of <strong>Brent</strong><br />
in 2007 states that on average people live longer in<br />
<strong>Brent</strong> than Engl<strong>and</strong> overall <strong>and</strong> female life expectancy<br />
is rising faster than in Engl<strong>and</strong>. However there is a stark<br />
difference in the life expectancy within the deprived areas<br />
compared to the more affluent areas. These differences<br />
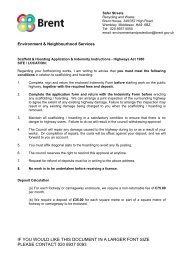
can be illustrated by examining male life expectancy<br />
along the Bakerloo line where a journey of 3.5 miles<br />
takes you from Harlesden which has the lowest life<br />
expectancy level <strong>for</strong> men to South Kenton where life<br />
expectancy is over 9 years longer.<br />
Map 6: Male Life-Expectancy Gaps Between Deprived<br />
<strong>and</strong> Affluent Wards in <strong>Brent</strong> (Harlesden to South Kenton<br />
along the Bakerloo Line)<br />
Preston<br />
N. WEMBLEY<br />
Barnhill<br />
Wembley Central<br />
Alperton<br />
Queensbury<br />
Tokyngton<br />
WEMBLEY CENTRAL<br />
Fryent<br />
Welsh Harp<br />
Stonebridge<br />
STONEBRIDGE PARK<br />
HARLESDON<br />
Harlesden<br />
WILLSDEN JUNCTION<br />
Dollis Hill<br />
Dudden Hill<br />
Willesden Green<br />
Kensal Green<br />
Bakerloo Tube Line<br />
Bakerloo Line Stations<br />
Mapesbury<br />
Brondesbury Park<br />
Queen’s Park<br />
KENSAL GREEN<br />
2001 - 2005<br />
Male Life Expectancy<br />
by Ward (Years)<br />
80 to 81<br />
79 to 80<br />
77 to 78<br />
76 to 77<br />
75 to 76<br />
74 to 75<br />
73 to 74<br />
72 to 73<br />
71 to 72<br />
70 to 71<br />
Kilburn<br />
QUEEN’S PARK
![0702012-khat[1] - Brent Council](https://img.yumpu.com/11457346/1/184x260/0702012-khat1-brent-council.jpg?quality=85)