Planning for Sport and Active Recreation Facilities ... - Brent Council
Planning for Sport and Active Recreation Facilities ... - Brent Council
Planning for Sport and Active Recreation Facilities ... - Brent Council

Create successful ePaper yourself
Turn your PDF publications into a flip-book with our unique Google optimized e-Paper software.
Chapter six Outdoor <strong>Sport</strong>s <strong>Facilities</strong><br />
A desktop study of outdoor sports provision was initiated<br />
by the <strong>Council</strong> <strong>and</strong> assessed through a physical audit<br />
of <strong>Brent</strong>’s outdoor facilities. The audit looked at the<br />
quantity, quality <strong>and</strong> access to sports pitches, courts, ball<br />
courts / Multi use games areas (MUGA’s), changing <strong>and</strong><br />
ancillary facilities, <strong>and</strong> school <strong>and</strong> college sports facilities<br />
in <strong>Brent</strong>.<br />
All Pitches<br />
Quantity<br />
The audit inspected 89 pitches; 46 pitches on 32 local<br />
authority sites (including Queens Park), 30 pitches on<br />
22 education sites, <strong>and</strong> 13 pitches on 11 private <strong>and</strong><br />
1 housing association sites. The audit only included<br />
pitches that were marked out <strong>and</strong> appeared to be in<br />
use, rather than spaces which were in<strong>for</strong>mal <strong>and</strong> could<br />
accommodate pitch sports. The numbers <strong>and</strong> types of<br />
these pitches are shown in the table below <strong>and</strong>, as the<br />
audit was undertaken during winter months, it is possible<br />
that some summer pitches have been excluded.<br />
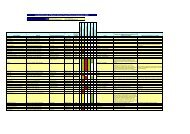
Table 21: Number of pitches by each pitch type<br />
The majority of playing pitches in the borough are<br />
maintained by the Local Authority, most of which are<br />
located within <strong>Brent</strong> Parks <strong>and</strong> open spaces. The most<br />
common type of pitch is football. Of the 29 education<br />
sites visited (nursery, primary, secondary, tertiary <strong>and</strong><br />
other), only 22 had some outdoor sports provision.<br />
Very few education sites have their own sports pitches<br />
with only 8 of <strong>Brent</strong>’s 14 Secondary Schools <strong>and</strong> 5 of<br />
the 60 Primary Schools having sports pitches. There are<br />
currently 2 decommissioned football pitches at Copl<strong>and</strong><br />
Community School <strong>and</strong> Chalkhill Youth Centre.<br />
<strong>Brent</strong> has a relatively low number of ‘privately owned’<br />
pitches. This number may have been greater in the past<br />
as a number of sites were developed <strong>for</strong> alternative uses<br />
during the mid 1990s.<br />
Quality<br />
The quality of pitches was also assessed in accordance<br />
with a modified <strong>Sport</strong> Engl<strong>and</strong> Visual Quality Assessment<br />
(VQA). The results are shown in table 22. This shows<br />
that the vast majority of pitches in the borough are of<br />
average, below average, or poor quality.<br />
The local authority pitches were assessed to be in the<br />
worst condition, with 89% of pitches being average or<br />
below quality <strong>and</strong> none rated as excellent. The quality<br />
of education pitches is generally better although 21%<br />
are still rated as below average, <strong>and</strong> two fifths rated as<br />
average. None are rated as excellent. The private pitches<br />
overall ranked higher in terms of quality. However, the<br />
quality of private pitches varies, with almost a third below<br />
Pitch Type No. of LA Pitches No. of Education Pitches No. of Private Pitches<br />
Football 36 26 + 2 decommissioned 8<br />
Cricket 6 3 4<br />
Gaelic Football 3 0 0<br />
Rugby 2 1 1<br />
Total 46 30 13<br />
average. Only one pitch is rated as excellent being the<br />
cricket pitch at South Hampstead Cricket Club.<br />
Table 22: Pitch Quality Ratings<br />
Rating % LA Pitches % Education Pitches % Private Pitches<br />
An excellent pitch 0.0 0.0 7.7<br />
A good pitch 10.9 36.8 38.5<br />
An average pitch 26.1 42.1 23.1<br />
A below average pitch 54.3 21.1 30.8<br />
A poor pitch 8.7 0.0 0.0<br />
Chapter Six - Outdoor <strong>Sport</strong>s <strong>Facilities</strong> 70


![0702012-khat[1] - Brent Council](https://img.yumpu.com/11457346/1/184x260/0702012-khat1-brent-council.jpg?quality=85)