Planning for Sport and Active Recreation Facilities ... - Brent Council
Planning for Sport and Active Recreation Facilities ... - Brent Council
Planning for Sport and Active Recreation Facilities ... - Brent Council

You also want an ePaper? Increase the reach of your titles
YUMPU automatically turns print PDFs into web optimized ePapers that Google loves.
41<br />
This chapter describes <strong>Sport</strong> Engl<strong>and</strong>’s various planning tools that<br />
have been used in chapter six to assess levels of supply <strong>and</strong> dem<strong>and</strong><br />
<strong>for</strong> indoor <strong>and</strong> outdoor facilities within <strong>Brent</strong>.<br />
To help analyse whether the levels of current provision <strong>and</strong> provision<br />
in future years will be sufficient to meet population dem<strong>and</strong>s, <strong>Sport</strong><br />
Engl<strong>and</strong> has developed a number of strategic planning tools to<br />
help assess dem<strong>and</strong> <strong>and</strong> provision. As each planning tool method<br />
assesses <strong>and</strong> calculates dem<strong>and</strong> <strong>and</strong> provision in a different way it is<br />
important that the in<strong>for</strong>mation arising from a number of the tools is<br />
used to in<strong>for</strong>m strategic priorities <strong>and</strong> that readers do not just focus<br />
on the findings of just one tool. There<strong>for</strong>e a variety of <strong>Sport</strong> Engl<strong>and</strong>’s<br />
planning tools have been used to in<strong>for</strong>m this strategy.<br />
<strong>Sport</strong>s Facility <strong>Planning</strong> Tools – Descriptions<br />
<strong>and</strong> Definitions.<br />
<strong>Active</strong> Places Power - Capacity Ratios<br />
<strong>Sport</strong> Engl<strong>and</strong>’s comprehensive nationwide database of sports<br />
facilities ‘<strong>Active</strong> Places Power’ allows the generation of a ‘Capacity<br />
Ratio’ based upon the frequency of a particular facility per 1000<br />
population within a local authority ward or borough. The Capacity<br />
Ratio gives an indication of current provision levels in relation to<br />
the existing population, which can then be compared against local,<br />
regional <strong>and</strong> national averages i.e. ‘x’ m2 facility provision per 1000<br />
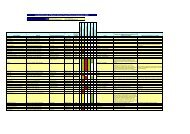
population. The table provides capacity ratios based on current levels<br />
of facility provision but calculates this against population figures from<br />
2001, 2011 <strong>and</strong> 2016.<br />
When comparing <strong>Brent</strong>’s capacity ratios with London <strong>and</strong> nationally it<br />
only compares calculations with current provision against population<br />
statistics from 2001. This will highlight any significant differences in<br />
provision in <strong>Brent</strong> compared to average provision elsewhere. It is also<br />
possible to calculate a Capacity Ratio based on <strong>Brent</strong>’s population<br />
projections. However, this data cannot then be compared against<br />
future regional <strong>and</strong> national averages as no such projections currently<br />
exist. This method also only looks at capacity within each individual<br />
Borough <strong>and</strong> does not take into consideration quality of provision or<br />
use of facilities within neighbouring Boroughs<br />
Accessibility – Choice <strong>and</strong> Opportunity.<br />
Previous national surveys have identified that the majority of facility<br />
users will travel <strong>for</strong> up to 20 minutes by foot in urban areas to attend<br />
a generic sports facility. Thus it is possible to generate catchment<br />
maps <strong>for</strong> each facility based on a 1.6km / 20 minute walking travel<br />
distance. It is also possible to generate maps which show in more<br />
detail how many minutes travel time by walking, parts of the<br />
Borough are from specific facilities. By using these maps <strong>and</strong> plotting<br />
the catchment of each facility it is easy to see at a glance those areas<br />
where people are within easy reach of a specific sports facility <strong>and</strong><br />
those areas which are not. For more specialised sports facilities it is<br />
recognised that people will travel considerably further.


![0702012-khat[1] - Brent Council](https://img.yumpu.com/11457346/1/184x260/0702012-khat1-brent-council.jpg?quality=85)